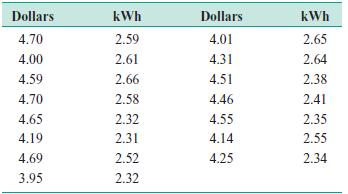
An industrial engineer at a furniture manufacturing plant wishes to investigate how the plants electricity usage depends
Question:
An industrial engineer at a furniture manufacturing plant wishes to investigate how the plant’s electricity usage depends on the amount of the plant’s production. He suspects that there is a simple linear relationship between production measured as the value in million dollar units of furniture produced in that month (x) and the electrical usage in units of kWh (kilowatt-hours, y). The following data were collected

(a) Draw a scatter diagram of these data. Does a straight-line relationship seem plausible?
(b) Fit a simple linear regression model to these data.
(c) Test for significance of regression using 0.05. What is the P-value for this test?
(d) Find a 95% CI estimate on the slope.
(e) Test the hypothesis H0: 1 0 versus H1: 1 0 using 0.05. What conclusion can you draw about the slope coefficient?
(f) Test the hypothesis H0: 0 0 versus H1: 0 0 using 0.05. What conclusions can you draw about the best model?
Step by Step Answer:

Engineering Statistics
ISBN: 9780471388791
2nd Edition
Authors: Douglas C. Montgomery, George C. Runger, Norma F. Hubele


