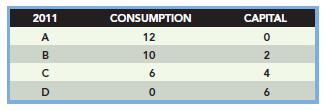
4. Imagine an economy with the following resource base for the year 2011: 100 units of labor...
Question:
4. Imagine an economy with the following resource base for the year 2011: 100 units of labor 100 units of capital, and 100 acres of land. Draw a graph showing the economy’s production possibilities from the following table:


On the same graph, draw the economy’s production possibilities curve for the year 2021.
Which possibilities in 2011 (among A, B, C, and D) can account for the 2021 curve, and how would such a production possibilities combination affect the economy’s resource base for 2021?
Fantastic news! We've Found the answer you've been seeking!
Step by Step Answer:
Related Book For 

Question Posted:


