Question:
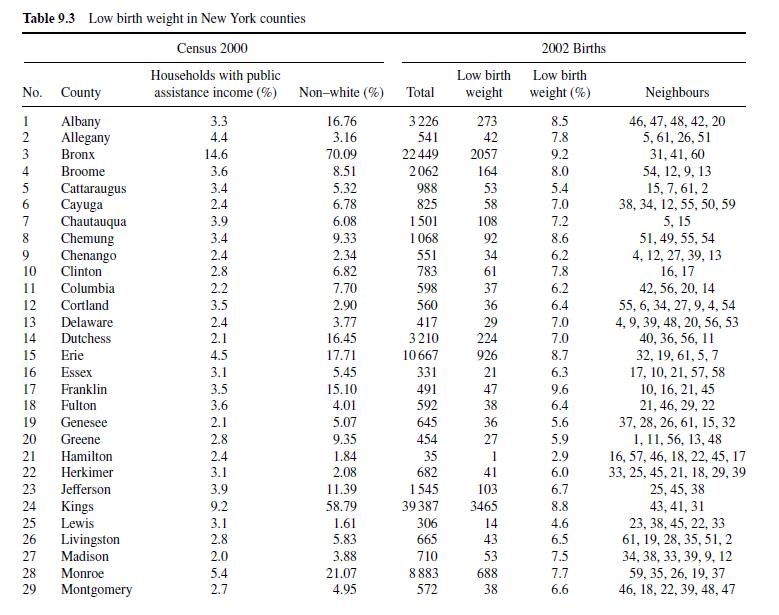
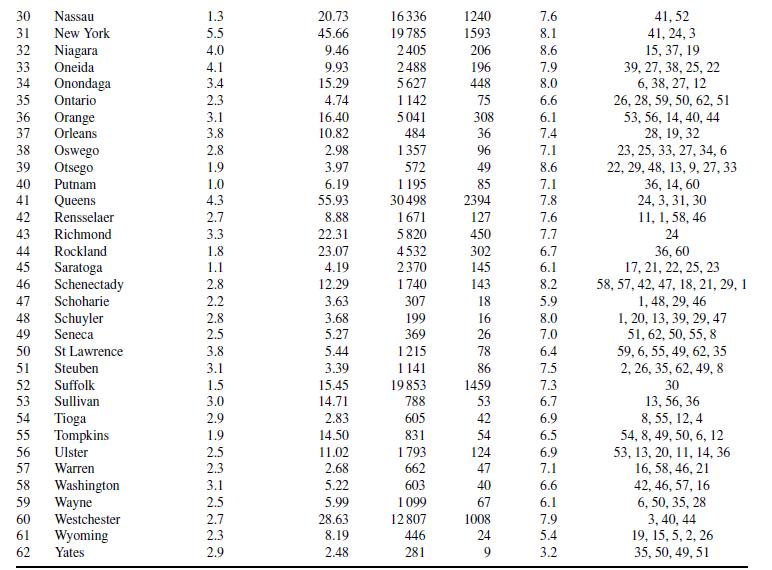
1. In Example 9.2 try scale mixing with ν unknown and assess whether the probit link is the most appropriate one.


Transcribed Image Text:
Table 9.3 Low birth weight in New York counties Census 2000 2002 Births Households with public Low birth No. County assistance income (%) Non-white (%) Total weight Low birth weight (%) 12345 Albany Allegany 3.3 16.76 3226 273 8.5 4.4 3.16 541 42 7.8 Bronx 14.6 70.09 22449 2057 9.2 Broome 3.6 8.51 2062 164 8.0 5 Cattaraugus 3.4 5.32 988 53 5.4 6 Cayuga 2.4 6.78 825 58 7.0 7 Chautauqua 3.9 6.08 1501 108 7.2 8 Chemung 3.4 9.33 1:068 92 8.6 9 Chenango 2.4 2.34 551 34 6.2 10 Clinton 2.8 6.82 783 61 7.8 11 Columbia 2.2 7.70 598 37 6.2 12 Cortland 3.5 2.90 560 36 6.4 13 Delaware 2.4 3.77 417 29 7.0 14 Dutchess 2.1 16.45 3210 224 7.0 15 Erie 4.5 17.71 10667 926 8.7 16 Essex 3.1 5.45 331 21 6.3 17 Franklin 3.5 15.10 491 47 9.6 18 Fulton 3.6 4.01 592 38 6.4 19 Genesee 2.1 5.07 645 36 5.6 20 Greene 2.8 9.35 454 27 5.9 21 Hamilton 2.4 1.84 35 1 2.9 Neighbours 46, 47, 48, 42, 20 5,61, 26, 51 31,41,60 54, 12, 9, 13 15, 7, 61, 2 38, 34, 12, 55, 50, 59 5,15 51, 49, 55, 54 4, 12, 27, 39, 13 16, 17 42, 56, 20, 14 55, 6, 34, 27, 9, 4, 54 4, 9, 39, 48, 20, 56, 53 40, 36, 56, 11 32, 19, 61, 5, 7 17, 10, 21, 57, 58 10, 16, 21, 45 21, 46, 29, 22 37, 28, 26, 61, 15, 32 1, 11, 56, 13, 48 16, 57, 46, 18, 22, 45, 17 22 Herkimer 3.1 2.08 682 41 6.0 33, 25, 45, 21, 18, 29, 39 23 Jefferson 3.9 11.39 1545 103 6.7 24 Kings 9.2 58.79 39387 3465 8.8 25 Lewis 3.1 1.61 306 14 4.6 25, 45, 38 43, 41, 31 23, 38, 45, 22, 33 26 Livingston 2.8 5.83 665 43. 6.5 61, 19, 28, 35, 51, 2 27 Madison 2.0 3.88 710 53 7.5 34, 38, 33, 39, 9, 12 28 Monroe 5.4 21.07 8883 688 7.7 29 Montgomery 2.7 4.95 572 38 6.6 59, 35, 26, 19, 37 46, 18, 22, 39, 48, 47


