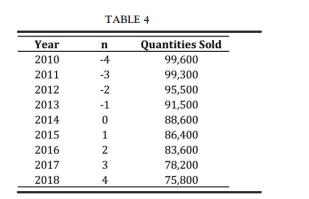
A company shows the following historical sales data (Table 4): a. Run the linear regression model and
Question:
A company shows the following historical sales data (Table 4):
a. Run the linear regression model and obtain the ANOVA table.
b. Make a prediction of the quantity sold for year 2019 and build the prediction interval at 95%.
c. Use the built-in Excel Forecast Sheet to make a sale prediction for 2019.
d. Plot the results. 5. The parent company revenues and the branch revenues of a company, over 3 years and by quarter, are compared in Table

Fantastic news! We've Found the answer you've been seeking!
Step by Step Answer:
Related Book For 

Elements Of Numerical Mathematical Economics With Excel Static And Dynamic Optimization
ISBN: 9780128176498
1st Edition
Authors: Giovanni Romeo
Question Posted:


