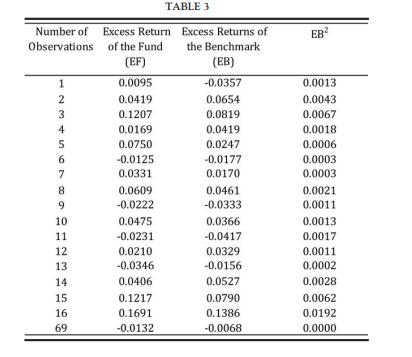
Table 3 puts together the excess (over a risk-free rate) monthly returns of a mutual fund versus
Question:
Table 3 puts together the excess (over a risk-free rate) monthly returns of a mutual fund versus its benchmark.
 According to the model of TreynoreMazuy,1 we want to run the following regression: EF ¼ a þ bEB þ gEB2 to assess whether the fund shows a market timing ability or not. Remark: this regression is called second-degree polynomial regression as the only explanatory variable on the right-hand side appears with various powers (here up to 2), thus making the regression a multiple regression model. Since the second-degree polynomial (or the kth degree polynomial) is linear in the parameters, these can be estimated by the usual OLS methodology. Essentially, there will be market timing ability when the fund is able to anticipate major turns in the stock market (i.e., the benchmark). This is so when the characteristic line of the fund versus its benchmark is not perfectly straight but shows a curvature upward. Therefore, the g factor in our regression is the coefficient that we want to study statistically (whether this is statistically significant or not).
a. Run the multiple regression (polynomial in two independent variables) and draw conclusions about the market timing of the mutual fund. Run also a standard univariate regression.
b. Obtain the ANOVA tables.
c. Build a frequency chart and a density chart for the returns of the fund.
Step by Step Answer:

Elements Of Numerical Mathematical Economics With Excel Static And Dynamic Optimization
ISBN: 9780128176498
1st Edition
Authors: Giovanni Romeo


