

Question: A professor who teaches a large introductory statistics class (197 students) with eight discussion sections would like to test if student performance differs by discussion
A professor who teaches a large introductory statistics class (197 students) with eight discussion sections would like to test if student performance differs by discussion section, where each discussion section has a different teaching assistant. The summary table below shows the average final exam score for each discussion section as well as the standard deviation of cores and the number of students in each section.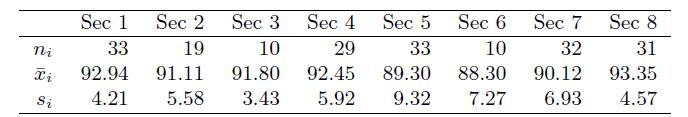
The ANOVA output below can be used to test for differences between the average scores from the different discussion sections.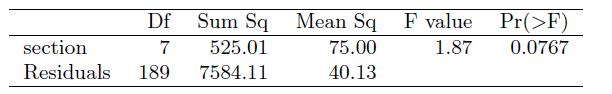
Conduct a hypothesis test to determine if these data provide convincing evidence that the average score varies across some (or all) groups. Check conditions and describe any assumptions you must make to proceed with the test.
ni Ti Si Sec 1 33 92.94 4.21 Sec 2 19 Sec 3 10 91.11 91.80 5.58 3.43 Sec 4 29 92.45 5.92 Sec 5 33 89.30 9.32 Sec 6 10 88.30 7.27 Sec 7 32 90.12 6.93 Sec 8 31 93.35 4.57
Step by Step Solution
3.36 Rating (165 Votes )
There are 3 Steps involved in it
To test whether there is convincing evidence that the average exam scores vary across different discussion sections we can conduct a oneway Analysis o... View full answer

Get step-by-step solutions from verified subject matter experts