

Question: Describe the distribution in the histograms below and match them to the box plots. 50 60 (a) 70 50 (b) 100 0 2 4 6
Describe the distribution in the histograms below and match them to the box plots.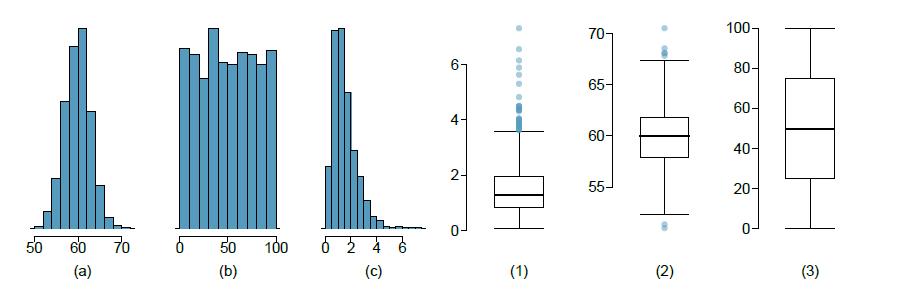
50 60 (a) 70 50 (b) 100 0 2 4 6 (c) 6 2- ***** (1) 70- 65- 60- 55- (2) 100- 80- 60- 40- 20- (3)
Step by Step Solution
★★★★★
3.40 Rating (150 Votes )
There are 3 Steps involved in it
1 Expert Approved Answer
Step: 1 Unlock

To match the histograms on the left to the box plots on the right we need to evaluate the shape cent... View full answer
Question Has Been Solved by an Expert!
Get step-by-step solutions from verified subject matter experts
Step: 2 Unlock
Step: 3 Unlock