

12. The following table represents sales data for pounds of butter (in hundreds) sold by a supermarket.
Question:
12. The following table represents sales data for pounds of butter (in hundreds) sold by a supermarket.
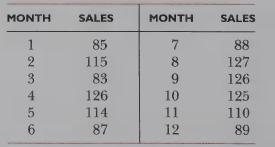
a. Use single exponential smoothing to forecast demand, with an of 0.20 and an initial forecast of 100.0.
b. Calculate the single exponential smoothed forecast, using an a of 0.30 and an initial forecast of 100.0.
c. Calculate the MAD for both forecasts. (Use all 12 months of data.)
Fantastic news! We've Found the answer you've been seeking!
Step by Step Answer:

Answered By
Nandana Wijayarathna
I am a highly experienced writer in several areas,
Business management
Information technology
Business administration
Literature
Biology
Environmental science
History
161+ Reviews
399+ Question Solved
Related Book For 

Operations Management Providing Value In Goods And Services
ISBN: 9780030262074
3rd Edition
Authors: Dilworth, James B
Question Posted:
