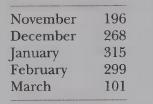
9. Demand for a certain model of snowboard during the past 5 months is shown below: a.
Question:
9. Demand for a certain model of snowboard during the past 5 months is shown below:

a. Compute the forecast demand for each month from November through March, us- ing single exponential smoothing with a = 0.2. Assume that the forecast for No- vember was 212.
b. Compute the MAD for this forecasting model based on the data for December, January, February, and March.
Fantastic news! We've Found the answer you've been seeking!
Step by Step Answer:
Related Book For 

Operations Management Providing Value In Goods And Services
ISBN: 9780030262074
3rd Edition
Authors: Dilworth, James B
Question Posted:


