

3 Quarterly sales for a department store over a six-year period are given in Table 22 (file...
Question:
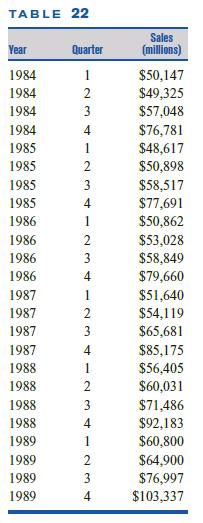
3 Quarterly sales for a department store over a six-year period are given in Table 22 (file Sales.xls).
a Use multiple regression to develop a model that can

be used to predict future quarterly sales. (Hint: Use dummy variables and an independent variable for the number of the quarter (quarter 1, quarter 2, . . . , quarter 24).
b Letting Yt sales during quarter number t, discuss how to fit the following model to the data in Table 22:
Yt b0bt 1b2 x2b3 x3b4 x4 where x2 1 if t is a first quarter, x3 1 if t is a second quarter, and x4 1 if t is a fourth quarter. (Hint: Take logarithms of both sides.)
c Interpret the answer to part (b).
d Which model appears to yield better predictions for sales?
Step by Step Answer:


Operations Research Applications And Algorithms
ISBN: 9780534380588
4th Edition
Authors: Wayne L. Winston
