

3 Table 27 gives the following data for monthly U.S. housing sales (in thousands of houses) for...
Question:
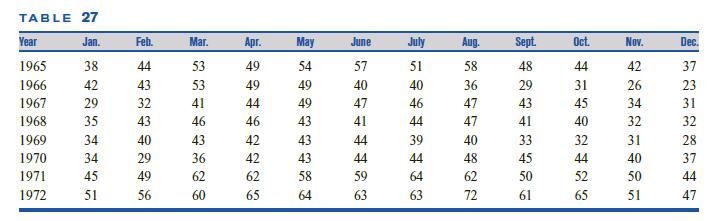
3 Table 27 gives the following data for monthly U.S.
housing sales (in thousands of houses) for 1965–1972.
a Use the years 1965–1966 to initialize the parameters for Winter’s method. Then find values of
a, b, and g that yield a MAD (for 1967–1972) of less than 3.5. (Hint: It may be necessary to use a 0.5.)
b We would expect 68% of our forecasts to be accurate within _____ and 95% of our forecasts to be accurate within _____.
c Check to see whether the data are consistent with the answer to part (b).
d Although we have not discussed autocorrelation for smoothing methods, good forecasts derived from smoothing methods should exhibit no autocorrelation.
Do the forecast errors for this problem exhibit autocorrelation?
e It has been stated that if only trend and seasonality are important factors, then a should be at most 0.5. Explain why this problem required a 0.5.
f At the end of December 1972, what is the forecast for housing sales during the first three months of 1973?
Note: This assignment is a snap on a spreadsheet.
The spreadsheet might be set up as in Table 28. In B14, enter A$3*A14/D2(1-A$3)*(B13C13). Insert analogous formulas in C14, D14, E14. Remember that the forecast must be made before “seeing” A14. In F14, enter A14-E14. In G14, enter ABS(F14). Copy from B14:G14 to ??. To compute MAD, average the absolute errors for each month (rows 14–85).
Step by Step Answer:


Operations Research Applications And Algorithms
ISBN: 9780534380588
4th Edition
Authors: Wayne L. Winston
