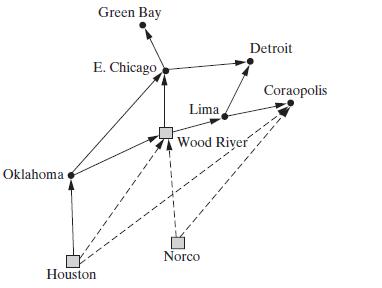
The figure that follows shows a part of a distribution network like those used by Shell Oil
Question:
The figure that follows shows a part of a distribution network like those used by Shell Oil Company16 to supply the midwest with its three main classes of product: gasoline, kerosene/jet fuel, and fuel oil.
Solid links shown indicate available pipelines, but products can also be shipped by barge from the refineries at Houston and Norco to depots at Wood River and/or Coraopolis. Wood River is also a refinery. Flows must meet known demands di,p for the various products p at all nodes i. The three refineries have known production capacities bi,p for production of product p at refinery i, and a pipeline from point i to point j can carry combined total of at most ui,j barrels of product.
Barge capacity is essentially unlimited. Refining costs are assumed fixed, and cost per barrel ci,j to transport along links from i to j is the same for all products.
(a) Formulate an LP model to determine a minimum total cost distribution plan.
(b) Show that your model can be viewed as a multicommodity flow problem by sketching the corresponding network, labeling arcs with costs and capacities, and nodes with net demands.
Step by Step Answer:


