

9. Consider the data from the chemical reaction experiment from Box and Meyer (1993) shown in the...
Question:
9. Consider the data from the chemical reaction experiment from Box and Meyer (1993) shown in the table below. The rst ve columns dened the factor settings for the experiment, and the remaining unassigned columns represent aliased interactions.
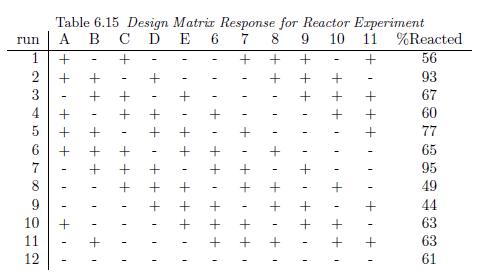
(a) Use proc glm to calculate the eects for all eleven columns and make a half-normal plot.
(b) Use proc reg to perform an all subsets regression using all main eects and two-factor interactions as candidate variables.
(c) What model do you feel is appropriate for the data?
(d) What factor settings would you recommend to maximize the %Reacted.
Step by Step Answer:

This question has not been answered yet.
You can Ask your question!
Related Book For 
Question Posted:
