

Question: (a) What does Figure (34.48 b) tell you about the relationship between the frequency of the incident light and the maximum kinetic energy of the
(a) What does Figure \(34.48 b\) tell you about the relationship between the frequency of the incident light and the maximum kinetic energy of the ejected electrons?
(b) What does the intercept of the line through the data points and the horizontal axis represent?
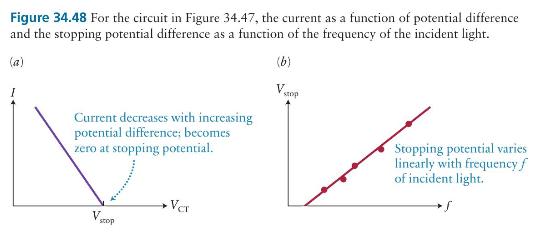
Figure 34.48 For the circuit in Figure 34.47, the current as a function of potential difference and the stopping potential difference as a function of the frequency of the incident light. (a) (b) V stop Current decreases with increasing potential difference; becomes zero at stopping potential. VCT Stopping potential varies linearly with frequency f of incident light.
Step by Step Solution
3.43 Rating (156 Votes )
There are 3 Steps involved in it

Get step-by-step solutions from verified subject matter experts