

Question: Figure (mathrm{P} 2. 52) is the position-versus-time graph for a moving object. What is the object's average velocity (a) between (t=0) and (t=1.0 mathrm{~s}, (b)
Figure \(\mathrm{P} 2. 52\) is the position-versus-time graph for a moving object. What is the object's average velocity
(a) between \(t=0\) and \(t=1.0 \mathrm{~s},
(b) between \(t=0\) and \(t=4.0 \mathrm{~s}\), and
(c) between \(t=3.0 \mathrm{~s}\) and \(t=6.0 \mathrm{~s}\) ?
(d) What is its average speed between \(t=3.0 \mathrm{~s}\) and \(t=6.0 \mathrm{~s}\) ?
(e) Draw to scale the velocity vector for the intervals \(t=3.0 \mathrm{~s}\) to \(t=3.5 \mathrm{~s}, t=3.5 \mathrm{~s}\) to \(t=4.0 \mathrm{~s}\), \(t=4.0 \mathrm{~s}\) to \(t=5.0 \mathrm{~s}\), and \(t=5.0 \mathrm{~s}\) to \(t=6.0 \mathrm{~s}\).
(f) What is the sum of all the vectors you drew in part \(e\) ?
Data from Figure P2.52
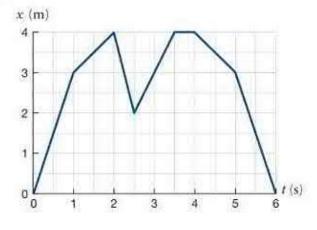
x (m) 3 2 M 0 0 2 3 4 5 6 t(s)
Step by Step Solution
3.48 Rating (158 Votes )
There are 3 Steps involved in it

Get step-by-step solutions from verified subject matter experts