

Question: FIGURE EX2.5 shows the position graph of a particle. a. Draw the particles velocity graph for the interval 0 s £ t £ 4 s.
FIGURE EX2.5 shows the position graph of a particle.
a. Draw the particle€™s velocity graph for the interval 0 s £ t £ 4 s.
b. Does this particle have a turning point or points? If so, at what time or times?
Figure Ex 2.5
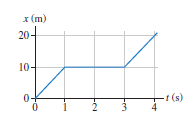
x (m) 20- 10- (s)
Step by Step Solution
★★★★★
3.37 Rating (153 Votes )
There are 3 Steps involved in it
1 Expert Approved Answer
Step: 1 Unlock

a We can obtain the values for the velo... View full answer
Question Has Been Solved by an Expert!
Get step-by-step solutions from verified subject matter experts
Step: 2 Unlock
Step: 3 Unlock
Document Format (2 attachments)
1442_6054778b32849_641460.pdf
180 KBs PDF File
1442_6054778b32849_641460.docx
120 KBs Word File