

Question: Figure EX26.4 is a graph of E x . The potential at the origin is -50 V. What is the potential at x = 3.0
Figure EX26.4 is a graph of Ex. The potential at the origin is -50 V. What is the potential at x = 3.0 m?
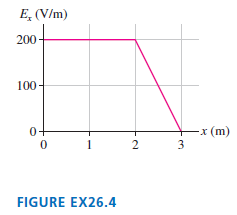
E, (V/m) 200 100 0+ -x (m) 3 1 FIGURE EX26.4 2.
Step by Step Solution
★★★★★
3.19 Rating (163 Votes )
There are 3 Steps involved in it
1 Expert Approved Answer
Step: 1 Unlock

Model The potential difference is the negative of the area unde... View full answer
Question Has Been Solved by an Expert!
Get step-by-step solutions from verified subject matter experts
Step: 2 Unlock
Step: 3 Unlock
Document Format (2 attachments)
1442_6054778b6b89a_692578.pdf
180 KBs PDF File
1442_6054778b6b89a_692578.docx
120 KBs Word File