

Question: FIGURE Q39.1 shows the probability density for photons to be detected on the x-axis. a. Is a photon more likely to be detected at x
FIGURE Q39.1 shows the probability density for photons to be detected on the x-axis.
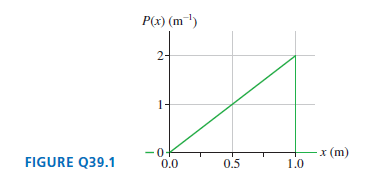
a. Is a photon more likely to be detected at x = 0 m or at x = 1 m? Explain.b. One million photons are detected. What is the expected number of photons in a 1-mm-wide interval at x = 0.50 m?
P(x) (m ') 2- FIGURE Q39.1 -0+ 0.0 x (m) 0.5 1.0
Step by Step Solution
★★★★★
3.50 Rating (160 Votes )
There are 3 Steps involved in it
1 Expert Approved Answer
Step: 1 Unlock

a At x 1 because the probability density is higher there b ... View full answer
Question Has Been Solved by an Expert!
Get step-by-step solutions from verified subject matter experts
Step: 2 Unlock
Step: 3 Unlock
Document Format (2 attachments)
1442_6054778bf0a77_701077.pdf
180 KBs PDF File
1442_6054778bf0a77_701077.docx
120 KBs Word File