

Question: How would table 9.7 change if sales decrease by 10 percent in each of the four scenarios considered? Table 9.7 Impact of operational and financial
How would table 9.7 change if sales decrease by 10 percent in each of the four scenarios considered?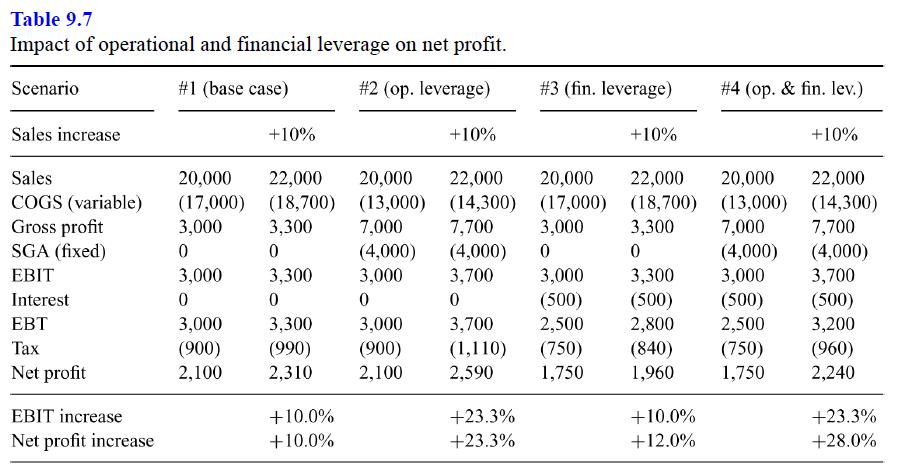
Table 9.7 Impact of operational and financial leverage on net profit. Scenario #1 (base case) #2 (op. leverage) #3 (fin. leverage) # 4 (op. & fin. lev.) Sales increase +10% +10% +10% +10% Sales 20,000 22,000 20,000 22,000 20,000 22,000 20,000 22,000 COGS (variable) (17,000) (18,700) (13,000) (14,300) (17,000) (18,700) (13,000) (14,300) Gross profit 3,000 3,300 7,000 7,700 3,000 3,300 7,000 7,700 SGA (fixed) 0 0 (4,000) (4,000) 0 0 (4,000) (4,000) EBIT 3,000 3,300 3,000 3,700 3,000 3,300 3,000 3,700 Interest 0 0 0 0 (500) (500) (500) (500) EBT 3,000 3,300 3,000 3,700 2,500 2,800 2,500 3,200 Tax (900) (990) (900) (1,110) (750) (840) (750) (960) Net profit 2,100 2,310 2,100 2,590 1,750 1,960 1,750 2,240 EBIT increase +10.0% +23.3% +10.0% +23.3% Net profit increase +10.0% +23.3% +12.0% +28.0%
Step by Step Solution
3.44 Rating (163 Votes )
There are 3 Steps involved in it

Get step-by-step solutions from verified subject matter experts