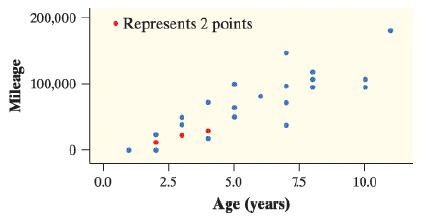
a. Explain what the value of r 2 tells you about how well the least squares line
Question:
a. Explain what the value of r2 tells you about how well the least squares line fits the data.
b. The mean age of the students’ cars in the sample was x¯ = 5 years. Find the mean mileage of the cars in the sample.
c. Interpret the value of s.
d. Would it be reasonable to use the least-squares line to predict a car’s mileage from its age for a Council High School teacher? Justify your answer.
Thirty randomly selected seniors at Council High School were asked to report the age (in years) and mileage of their main vehicles. Here is a scatterplot of the data:

We used Minitab to perform a least-squares regression analysis for these data. Part of the computer output from this regression is shown here.

Fantastic news! We've Found the answer you've been seeking!
Step by Step Answer:
Related Book For 

Question Posted:


