

Question: Refer to Exercise 10. Here are summary statistics for the state median household incomes: a. Find and interpret the z-score for North Carolina, with a
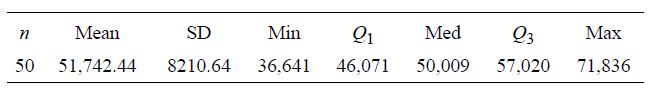
Refer to Exercise 10. Here are summary statistics for the state median household incomes:
a. Find and interpret the z-score for North Carolina, with a median household income of $41,553.
b. New Jersey had a standardized score of 1.82. Find New Jersey’s median household income for that year.
Exercise 10.
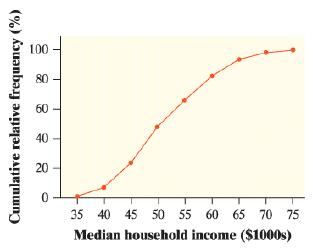
The cumulative relative frequency graph describes the distribution of median household incomes in the 50 states in a recent year.
Mean SD Min Q1 Med Q3 50 51,742.44 8210.64 36,641 46,071 50,009 57,020 71,836
Step by Step Solution
3.41 Rating (164 Votes )
There are 3 Steps involved in it
Here mean5174244 sd821064 n60 a z score is given by zxmeansd z415... View full answer

Get step-by-step solutions from verified subject matter experts
Document Format (2 attachments)
2048_61d6ac3429ea0_836271.pdf
180 KBs PDF File
2048_61d6ac3429ea0_836271.docx
120 KBs Word File