

Question: Refer to Exercise 6. Here is computer output from the least-squares regression analysis of the perch data. a. What is the estimate for 0
Refer to Exercise 6. Here is computer output from the least-squares regression analysis of the perch data.
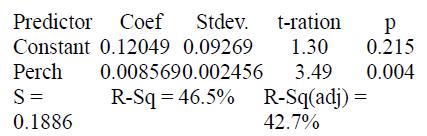
a. What is the estimate for β0? Interpret this value.
b. What is the estimate for β1? Interpret this value.
c. What is the estimate for σ? Interpret this value.
d. Give the standard error of the slope SEb1. Interpret this value.
Exercise 6.
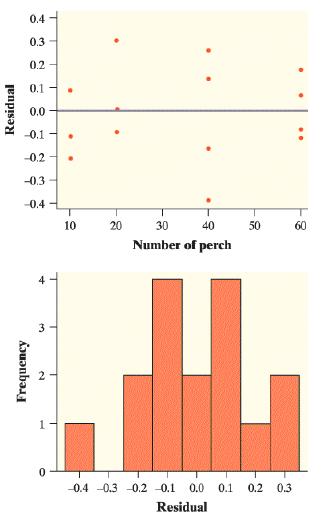
Here is one way in which nature regulates the size of animal populations: high population density attracts predators, which remove a higher proportion of the population than when the density of the prey is low. One study looked at kelp perch and their common predator, the kelp bass. On each of four occasions, the researcher set up four large circular pens on sandy ocean bottoms off the coast of southern California. He randomly assigned young perch to 1 of 4 pens so that one pen had 10 perch, one pen had 20 perch, one pen had 40 perch, and the final pen had 60 perch. Then he dropped the nets protecting the pens, allowing bass to swarm in, and counted the number of perch killed after two hours.4 A regression analysis was performed on the 16 data points using x = number of perch in pen and y = proportion of perch killed. Here is a residual plot and a histogram of the residuals. Check whether the conditions for performing inference about the regression model are met.
Predictor oef Stdev. t-ration Constant 0.12049 0.09269 1.30 0.215 Perch 0.0085690.002456 3.49 0.004 S= R-Sq = 46.5% R-Sq(adj) = 0.1886 42.7%
Step by Step Solution
3.47 Rating (167 Votes )
There are 3 Steps involved in it
a The estimate for 0 is 012049 which is the intercept of the regression line This means that when th... View full answer

Get step-by-step solutions from verified subject matter experts