

Question: The dotplot shows the difference (Highway City) in EPA mileage ratings, in miles per gallon (mpg) for each of 24 model year 2018 cars.
The dotplot shows the difference (Highway − City) in EPA mileage ratings, in miles per gallon (mpg) for each of 24 model year 2018 cars.
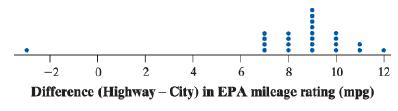
a. Explain what the dot above −3 represents.
b. What does the graph tell us about fuel economy in the city versus on the highway for these car models? Be specific.
2 4 8 10 12 Difference (Highway - City) in EPA mileage rating (mpg) eeeee
Step by Step Solution
★★★★★
3.48 Rating (174 Votes )
There are 3 Steps involved in it
1 Expert Approved Answer
Step: 1 Unlock

Dot plot is a type of simple histogram like chart used i... View full answer
Question Has Been Solved by an Expert!
Get step-by-step solutions from verified subject matter experts
Step: 2 Unlock
Step: 3 Unlock
Document Format (2 attachments)
2048_61d6ac34283e0_836179.pdf
180 KBs PDF File
2048_61d6ac34283e0_836179.docx
120 KBs Word File