According to Table 1, which of the following figures best represents the relationship between the height of
Question:
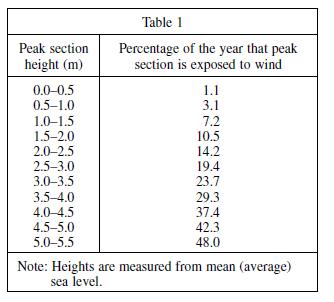
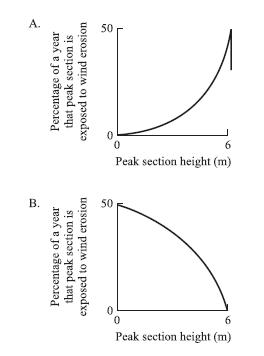
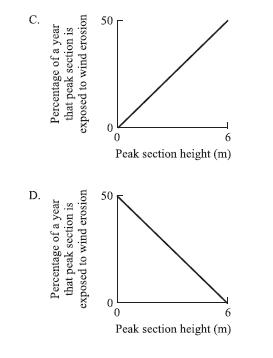
According to Table 1, which of the following figures best represents the relationship between the height of a peak section and the percentage of a year that peak section is exposed to wind erosion?


Transcribed Image Text:
Peak section height (m) 0.0-0.5 0.5-1.0 1.0-1.5 1.5-2.0 2.0-2.5 2.5-3.0 3.0-3.5 3.5-4.0 4.0-4.5 4.5-5.0 5.0-5.5 Table 1 Percentage of the year that peak section is exposed to wind 1.1 3.1 7.2 10.5 14.2 19.4 23.7 29.3 37.4 42.3 48.0 Note: Heights are measured from mean (average) sea level.
Fantastic news! We've Found the answer you've been seeking!
Step by Step Answer:
Answer rating: 75% (4 reviews)
The best answer is C Table 1 shows that as the peak sec...View the full answer

Answered By

Somshukla Chakraborty
I have a teaching experience of more than 4 years by now in diverse subjects like History,Geography,Political Science,Sociology,Business Enterprise,Economics,Environmental Management etc.I teach students from classes 9-12 and undergraduate students.I boards I handle are IB,IGCSE, state boards,ICSE, CBSE.I am passionate about teaching.Full satisfaction of the students is my main goal.
I have completed my graduation and master's in history from Jadavpur University Kolkata,India in 2012 and I have completed my B.Ed from the same University in 2013. I have taught in a reputed school of Kolkata (subjects-History,Geography,Civics,Political Science) from 2014-2016.I worked as a guest lecturer of history in a college of Kolkata for 2 years teaching students of 1st ,2nd and 3rd year. I taught Ancient and Modern Indian history there.I have taught in another school in Mohali,Punjab teaching students from classes 9-12.Presently I am working as an online tutor with concept tutors,Bangalore,India(Carve Niche Pvt.Ltd.) for the last 1year and also have been appointed as an online history tutor by Course Hero(California,U.S) and Vidyalai.com(Chennai,India).
4.00+
2+ Reviews
10+ Question Solved
Related Book For 

Question Posted:
Students also viewed these Business questions
-
Which of the following figures best illustrates the direction of the magnetic field (B) associated with a section of wire carrying a current? A. B. D.
-
Which of the following figures represents (a) a pure element, (b) a mixture of two elements, (c) a pure compound, (d) a mixture of an element and a compound? (More than one picture might fit each...
-
1. Hannah is applying for a life policy on her girlfriend Sarahs life. The policy is $500,000 and carries a large premium. Hannah is the main earner, so she is concerned about not being able to pay...
-
Custom Truck Builders frequently uses long-term lease contracts to finance the sale of its trucks. On November 1, 2015, Custom Truck Builders leased to Interstate Van Lines a truck carried in the...
-
Happy Days Balloon Company incurred $167,000 of manufacturing overhead costs during the year just ended. However, only $145,000 of overhead was applied to production. At the conclusion of the year,...
-
What is network optimization and what are some of the best practices that are used in the industry to optimize networks? Also, why is network documentation important and what are the security...
-
There are numerous foreign exchange calculators on the Internet, such as www.x-rates.com. You can find them through globalEDGE or by entering the keywords exchange rate in a Google search. Visit one...
-
The CFO of Turing Corporation is very uncomfortable with its current risk exposure related to the possibility of business disruptions. Specifically, Turing is heavily involved in e- business, and its...
-
A stock has an expected return of 13.2 percent, its beta is .70, and the risk-free rate is 3.3 percent. What must the expected return on the market be? (Do not round intermediate calculations. Enter...
-
Based on the results of Experiment 3, the greatest proportional growth was observed: Experiment 3 Ten samples of bacteria were placed in each of 2 Petri dishes. Four different environments were...
-
Given that all of the choices are true, which one provides the most logical cause for the action described in the statement immediately following this underlined portion? A. NO CHANGE B. That is,...
-
Indicate which of the actions (1 through 4) listed would be necessary for each of the situations (a through f) described below. 1. New cheque written 2. Recorded in general journal 3. Petty cash...
-
D manufacturing Company uses a process cost system. In the second department, Department X, spoiled units occur when units are 70% complete. Direct Materials are added at the end of the process....
-
This week, I read Pat Friman's 2021 article, "There Is no Such Thing As a Bad Boy: The Circumstances View of Problem Behavior," on adopting The Circumstances View when working with clients. In this...
-
Download the labour force statistic for Australia from the ABS website here. Use the data to answer the following questions only. You do not have to analyze the data. Show proof when you make...
-
Split Corporation manufactures products X, Y, and Z from a joint production process. Joint costs are allocated to products based on relative sales values of the products at the split-off point....
-
A television show conducted an experiment to study what happens when buttered toast is dropped on the floor. When 44 buttered slices of toast were dropped, 28 of them landed with the buttered side up...
-
Each firm in a competitive market has a cost function of C = q + q2 + q3. There are an unlimited number of potential firms in this market. The market demand function is Q = 24 - p. Determine the...
-
Do public and private companies follow the same set of accounting rules? Explain.
-
Why is mobile computing so important to these three firms? Evaluate the mobile strategies of each firm.
-
What is the significance of search to the success or failure of mobile computing? How have Apple and Facebook attempted to compete with Google? Will their strategies succeed?
-
Which company and business model do you think is most likely to dominate the Internet and why ?
-
Required information [The following information applies to the questions displayed below.] Dain's Diamond Bit Drilling purchased the following assets this year. Asset Drill bits (5-year) Drill bits...
-
Which of the following partnership items are not included in the self-employment income calculation? Ordinary income. Section 179 expense. Guaranteed payments. Gain on the sale of partnership...
-
Phantom Consulting Inc. is a small computer consulting business. The company is organized as a corporation and provides consulting services, computer system installations, and custom program...

Study smarter with the SolutionInn App


