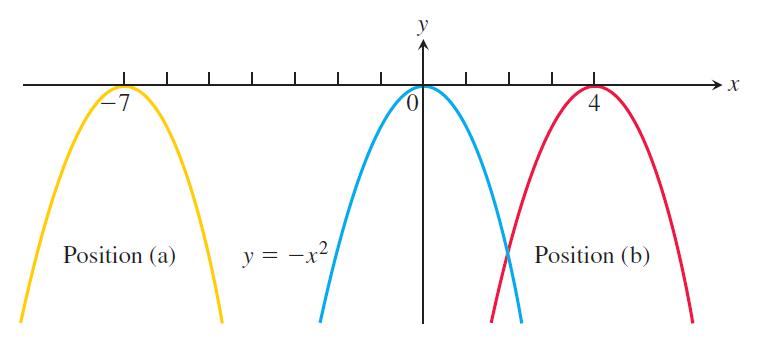
The accompanying figure shows the graph of y = -x 2 shifted to two new positions. Write
Question:
The accompanying figure shows the graph of y = -x2 shifted to two new positions. Write equations for the new graphs.
Transcribed Image Text:
-7 Position (a) y = -x² 0 4 Position (b) X
Fantastic news! We've Found the answer you've been seeking!
Step by Step Answer:
Answer rating: 62% (8 reviews)
a y ...View the full answer

Answered By

Utsab mitra
I have the expertise to deliver these subjects to college and higher-level students. The services would involve only solving assignments, homework help, and others.
I have experience in delivering these subjects for the last 6 years on a freelancing basis in different companies around the globe. I am CMA certified and CGMA UK. I have professional experience of 18 years in the industry involved in the manufacturing company and IT implementation experience of over 12 years.
I have delivered this help to students effortlessly, which is essential to give the students a good grade in their studies.
3.50+
2+ Reviews
10+ Question Solved
Related Book For 

Thomas Calculus Early Transcendentals
ISBN: 9780321884077
13th Edition
Authors: Joel R Hass, Christopher E Heil, Maurice D Weir
Question Posted:
Students also viewed these Mathematics questions
-
The accompanying figure shows the graph of y = x 2 shifted to two new positions. Write equations for the new graphs. - 0 5 Position (a) y = x Position (b) X
-
The accompanying figure shows the economy's capital market, with the initial equilibrium at point E, with an interest rate of i* and investment (and saving) equal to I*. a. Suppose the government...
-
The accompanying figure shows a body of mass 50 kg being lifted at a constant velocity of 1 m/s by the rope and pulley arrangement. Determine power delivered by the shaft. 1 m/s50 kg
-
If a= 3 m, determine the magnitudes of P and Q required to maintain the cable in the shape shown. DI 120 kN
-
A stock trades for $45 per share. A call option on that stock has a strike price of $50 and an expiration date 1 year in the future. The volatility of the stocks returns is 30%, and the risk-free...
-
The performance rating of employees classified as Above Expectations, Meets Expectations, or Below Expectations AppendixLO1
-
The following informations are available regarding a company: Budgeted Production 1,00,000 units Variable Cost Rs. 20 p.u. Fixed Costs 10,00,000 Profit 25% on Cost You are required to calculate the...
-
Famous Cut Hair Stylists has begun the preparation of its adjusted trial balance as follows: Year-end data include the following: a. Supplies on hand, $300. b. Depreciation, $1,000. c. Accrued...
-
a bond selling at par is paying 8% coupon semi-annually. What is the effective annual yield of this bond?
-
What is the period of each function? cos x
-
What is the period of each function? sin 2x
-
After interviewing a client in order to prepare a written investment policy statement (IPS), you have established the following: The client is best described as having a: A. Low ability to take risk,...
-
Pacifico Company, a U . S . - based importer of beer and wine, purchased 1 , 7 0 0 cases of Oktoberfest - style beer from a German supplier for 4 5 9 , 0 0 0 euros. Relevant U . S . dollar exchange...
-
Consider each of the following scenarios and identify a behavioral intervention to address each issue in family work. A teenager not complying with curfew. One member of the couple not picking up...
-
Sandy Crane Hospital expanded its maternity ward to add patient rooms for extended hospital stays. They negotiated a 15-year loan with monthly payments and a large sum of $250,000 due at the end of...
-
2 (39 marks) R QUESTION 2 (39 marks) Roundworm Ltd is a group of companies with a 31 December year-end. The Roundworm group financial statements for the years 20.21 and 20.22 are given below:...
-
Vino Veritas Company, a U.S.-based importer of wines and spirits, placed an order with a French supplier for 1,400 cases of wine at a price of 240 euros per case. The total purchase price is 336,000...
-
A single strain gage, placed in the vertical plane on the outer surface and at an angle 60° to the axis of the pipe, gives a reading at point A of ε A = -250(10 -6 ). Determine the...
-
A business had revenues of $280,000 and operating expenses of $315,000. Did the business (a) Incur a net loss (b) Realize net income?
-
In problem, solve each inequality. Graph the solution set. |4x + 1| 7
-
Graph each function using the techniques of shifting, compressing or stretching, and reflections. Start with the graph of the basic function and show all stages. (a) h(x) = -2(x + 1) 3 + 3 (b) g(x) =...
-
In problem, find the domain of each function. f(x) = 3x 2 /x - 2
-
The following amounts were reported on the December 31, 2022, balance sheet: Cash $ 8,000 Land 20,000 Accounts payable 15,000 Bonds payable 120,000 Merchandise inventory 30,000 Retained earnings...
-
Sandhill Co. issued $ 600,000, 10-year, 8% bonds at 105. 1.Prepare the journal entry to record the sale of these bonds on January 1, 2017. (Credit account titles are automatically indented when the...
-
Based on the regression output (below), would you purchase this actively managed fund with a fee of 45bps ? Answer yes or no and one sentence to explain why.

Study smarter with the SolutionInn App


