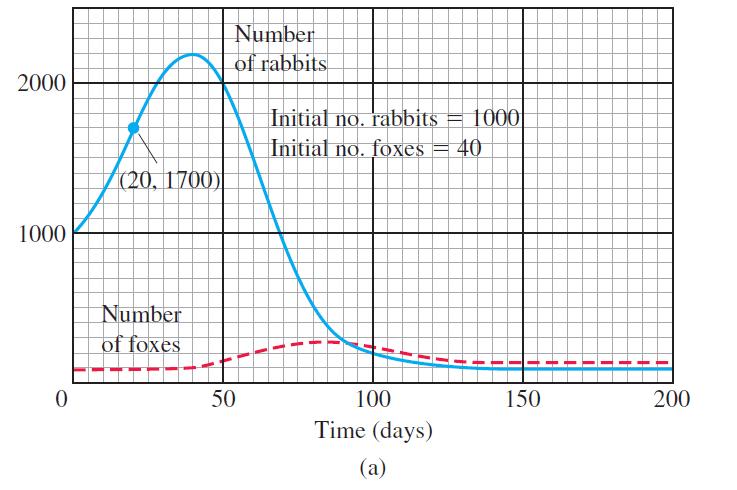
The accompanying graphs. The graphs in part (a) show the numbers of rabbits and foxes in a
Question:
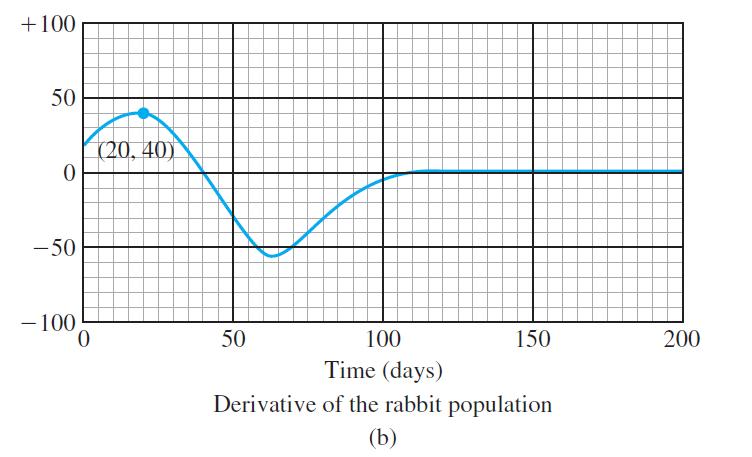
The accompanying graphs. The graphs in part (a) show the numbers of rabbits and foxes in a small arctic population. They are plotted as functions of time for 200 days. The number of rabbits increases at first, as the rabbits reproduce. But the foxes prey on rabbits and, as the number of foxes increases, the rabbit population levels off and then drops. Part (b) shows the graph of the derivative of the rabbit population, made by plotting slopes.
In what units should the slopes of the rabbit and fox population curves be measured?

Fantastic news! We've Found the answer you've been seeking!
Step by Step Answer:
Related Book For 

Thomas Calculus Early Transcendentals
ISBN: 9780321884077
13th Edition
Authors: Joel R Hass, Christopher E Heil, Maurice D Weir
Question Posted:


