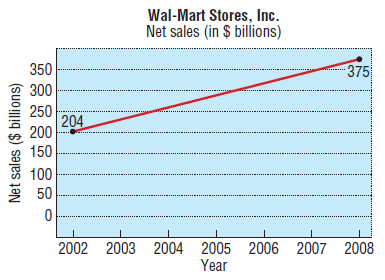
The figure illustrates how net sales of Wal-Mart Stores, Inc., have grown from 2002 through 2008. Use
Question:

Transcribed Image Text:
Wal-Mart Stores, Inc. Net sales (in $ billions) 350 375 300 250 204 200 ............. 150 100 9 50 2002 2003 2004 2005 2006 2007 2008 Year Net sales ($ billions)
Fantastic news! We've Found the answer you've been seeking!
Step by Step Answer:
Answer rating: 80% (15 reviews)
Let P 1 2002 204 and P 2 2008 375 The midpoint is Th...View the full answer

Answered By

Bhartendu Goyal
Professional, Experienced, and Expert tutor who will provide speedy and to-the-point solutions. I have been teaching students for 5 years now in different subjects and it's truly been one of the most rewarding experiences of my life. I have also done one-to-one tutoring with 100+ students and help them achieve great subject knowledge. I have expertise in computer subjects like C++, C, Java, and Python programming and other computer Science related fields. Many of my student's parents message me that your lessons improved their children's grades and this is the best only thing you want as a tea...
3.00+
2+ Reviews
10+ Question Solved
Related Book For 

Question Posted:
Students also viewed these Mathematics questions
-
Use the Box-Jenkins methodology to model and forecast the quarterly sales of Wal-Mart stores shown in Table P-27 in Chapter 5. TABLE P-27 Quarter Year 1990 1991 1992 1993 1995 1996 1997 1998 1999...
-
Currently, there are 4227 Wal-Mart stores in the United States and another 3210 stores outside of the United States. a. Are the numbers of Wal-Mart stores discrete or continuous? b. What is the level...
-
Wal-Mart is the second largest retailer in the world. The data file on the disk holds monthly data on Wal-Marts revenue, along with several possibly related economic variables. a) Using computer...
-
What is the type of the expressions computed on these two lines? 4 > 5 print (4>5)
-
Exercise 12 uses Data Set 23 "Old Faithful" in Appendix B, and the sample size is 250. a. If we have sample paired data with 250 nonzero differences, what are the smallest and largest possible values...
-
How large a sample should be selected to provide a 95% confidence interval with a margin of error of 10? Assume that the population standard deviation is 40.
-
Show Eqs. (11.55) and (11.56).
-
Lorance Corporation issued $800,000, 9%, 10-year bonds on January 1, 2014, for $750,150. This price resulted in an effective-interest rate of 10% on the bonds. Interest is payable semiannually on...
-
Part VI: More SPLIT/APPLY/COMBINE Suppose that Boeing has a fixed amount of money to invest into itself (Y) and another company (X). We must decide what fraction (a) of money to invest in Y = BA and...
-
During Year 1, Anthony Company purchased debt securities and holds the securities as available-for-sale. Pertinent data are as follows: Security Cost $20,000 TE 40,000 90,000 $150,000 A B Fair value...
-
In problem, list the intercepts and test for symmetry. y = x 2 - 3x - 4
-
In problem, find an equation for the line with the given properties. Express your answer using either the general form or the slopeintercept form of the equation of a line, whichever you prefer...
-
Consider the following sample data: a. Calculate the covariance between the variables. b. Calculate and interpret the correlationcoefficient. 2 2 2 18 2 12 27 15 20
-
Gil and Ruth George have been friends of yours for many years. They have come to you for advice on their estate plan since they want a second opinion to make sure it is going to do what they hope....
-
The test statistic of z = 1.74 is obtained when testing the claim that p # 0.658. Identify the hypothesis test as being two-tailed, left-tailed, or right-tailed. Find the P-value. Using a...
-
Ann and Bob had their first date. Each either felt romantic chemistry (C) or no chemistry (NC) with the other person. Each person knows his/her own feeling but does not know the feeling of the other...
-
Find the following using countif, countifs, sumif, sumifs, averageif, and averageifs. Create all formulas and calculations directing in Excel. How many songs are sung by Moore? What is the average...
-
Total number of Ledgers, Groups, Entries etc. can be shown from o a. Tally Audit o b. Statistics o c. Accounts Information o d. Company Information
-
Let z = (x, y) = 6x 2 - 4xy + 9y 2 . Find the following using the formal definition of the partial derivative. (a) z/x (b) z/y (c) f/x(2, 3) (d) y (1, -2)
-
For the following arrangements, discuss whether they are 'in substance' lease transactions, and thus fall under the ambit of IAS 17.
-
A salesperson must travel to eight cities to promote a new marketing campaign. How many different trips are possible if any route between cities is possible?
-
A certain compact disc player randomly plays each of 10 songs on a CD. Once a song is played, it is not repeated until all the songs on the CD have been played. In how many different ways can the CD...
-
Companies whose stocks are listed on the New York Stock Exchange (NYSE) have their company name represented by either one, two, or three letters (repetition of letters is allowed). What is the...
-
Aecerty 1067687 was completed with the folowing charaderistick Murulectere sec00 5xs:99 s35ida sputed
-
Assume todays settlement price on a CME EUR futures contract is $1.3180 per euro. You have a long position in one contract. EUR125,000 is the contract size of one EUR contract. Your performance bond...
-
Q2. Company ABC bought an equipment for $20,000 in 2015, with useful life of 5 years $5,000 residual value amortized using straight-line method. Prepare a table to illustrate the differences...

Study smarter with the SolutionInn App


