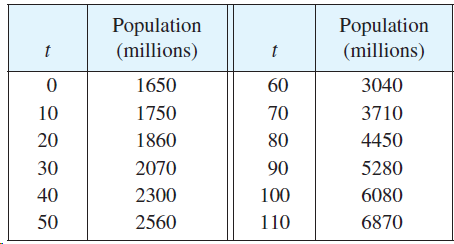
The table gives the population of the world P(t), in millions, where t is measured in years
Question:
The table gives the population of the world P(t), in millions, where t is measured in years and t = 0 corresponds to the year 1900.

(a) Estimate the rate of population growth in 1920 and in 1980 by averaging the slopes of two secant lines.
(b) Use a graphing device to find a cubic function (a thirddegree polynomial) that models the data.
(c) Use your model in part (b) to find a model for the rate of population growth.
(d) Use part (c) to estimate the rates of growth in 1920 and 1980. Compare with your estimates in part (a).
(e) In Section 1.1 we modeled P(t) with the exponential function f (t) = (1.43653 x 10⁹)? (1.01395)t Use this model to find a model for the rate of population growth.
(f) Use your model in part (e) to estimate the rate of growth in 1920 and 1980. Compare with your estimates in parts (a) and (d).
(g) Estimate the rate of growth in 1985.
Step by Step Answer:


