

Question: Develop a set of performance curves, similar to those shown in Figure 8.8, that illustrate the performance of a coherent demodulator as a function of
Develop a set of performance curves, similar to those shown in Figure 8.8, that illustrate the performance of a coherent demodulator as a function of the phase-error variance. Let the SNR be a parameter and express the SNR in decibels. As in Figure 8.8, assume a QDSB system. Repeat this exercise for a DSB system.
Figure 8.8
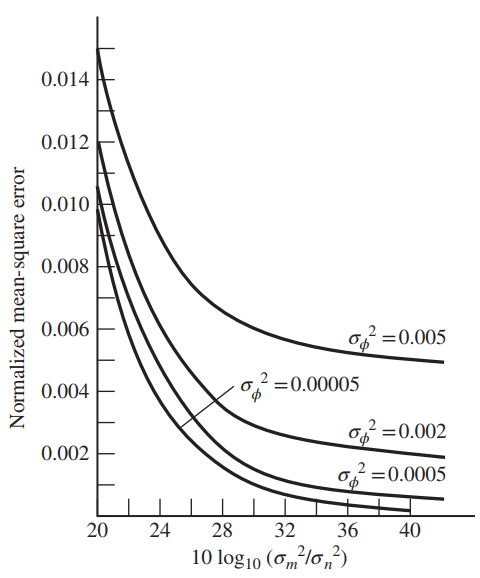
0.014 0.012 0.010 0.008 0.006 o =0.005 =0.00005 0.004 2 =0.002 0.002 =0.0005 20 24 28 32 36 40 10 log10 (mlo,?) Normalized mean-square error
Step by Step Solution
3.50 Rating (163 Votes )
There are 3 Steps involved in it
From the expression for the normalized error the following MATLAB program results File ce81am sn... View full answer

Get step-by-step solutions from verified subject matter experts