5. a. Plot the following risky portfolios on a graph: Portfolio A B C D E F...
Question:
5.
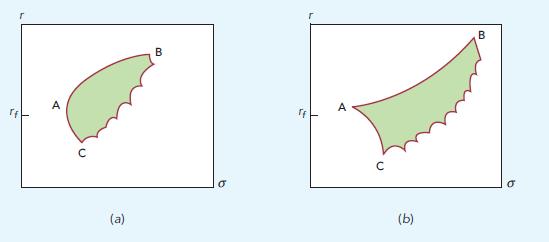
a. Plot the following risky portfolios on a graph:
Portfolio A B C D E F G H Expected return (r), % 10 12.5 15 16 17 18 18 20 Standard deviation ( ), % 23 21 25 29 29 32 35 45
b. Five of these portfolios are efficient, and three are not. Which are in efficient ones?
c. Suppose you can also borrow and lend at an interest rate of 12%. Which of the above portfolios has the highest Sharpe ratio?

d. Suppose you are prepared to tolerate a standard deviation of 25%. What is the maximum expected return that you can achieve if you cannot borrow or lend?
e. What is your optimal strategy if you can borrow or lend at 12% and are prepared to tolerate a standard deviation of 25%? What is the maximum expected return that you can achieve with this risk?
Step by Step Answer:


