Question:
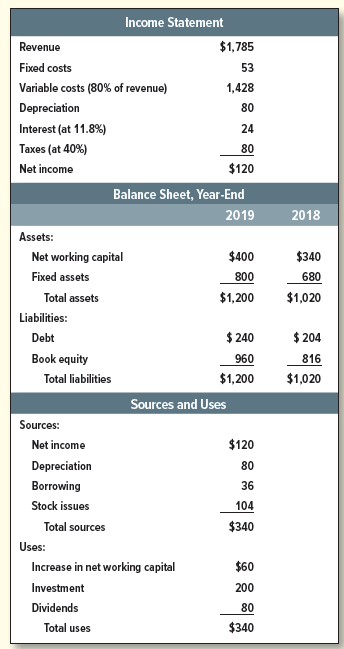
Table 29.18 shows the 2019 financial statements for the Executive Cheese Company. Annual depreciation is 10% of fixed assets at the beginning of the year, plus 10% of new investment. The company plans to invest a further $200,000 per year in fixed assets for the next five years and net working capital is expected to remain a constant proportion of fixed assets. The company forecasts that the ratio of revenues to total assets at the start of each year will remain at 1.75. Fixed costs are expected to remain at $53, and variable costs at 80% of revenue. The company?s policy is to pay out two-thirds of net income as dividends and to maintain a book debt ratio of 20%.
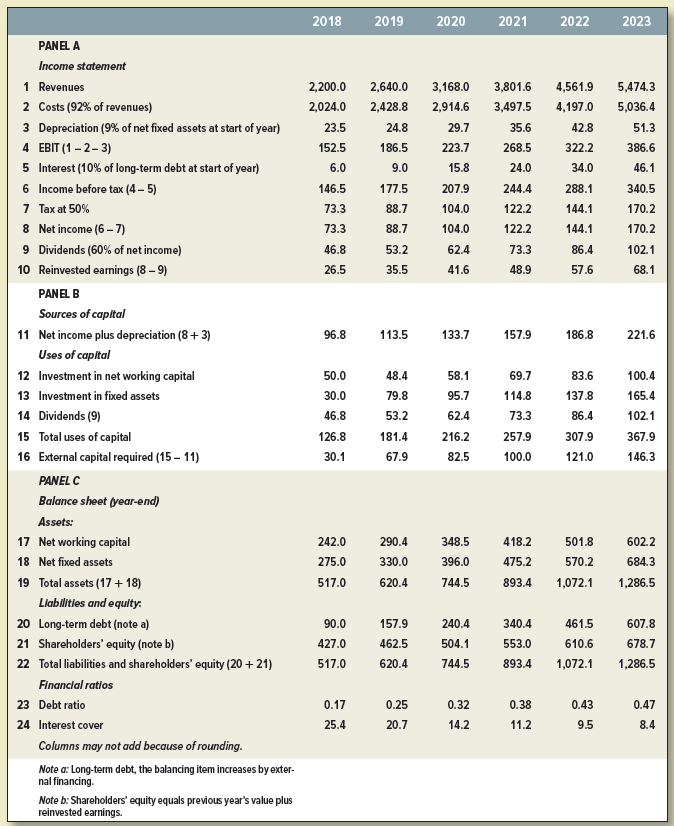
a. Construct a model for Executive Cheese like the one in Table 29.9.
b. Use your model to produce a set of financial statements for 2020.

Table 29.9

Financial Statements
Financial statements are the standardized formats to present the financial information related to a business or an organization for its users. Financial statements contain the historical information as well as current period’s financial...
Transcribed Image Text:
Income Statement $1,785 Revenue Fixed costs 53 Variable costs (80% of revenue) 1,428 Depreciation 80 Interest (at 11.8%) 24 Taxes (at 40%) 80 $120 Net income Balance Sheet, Year-End 2019 2018 Assets: Net working capital $400 $340 Fixed assets 800 680 $1,200 $1,020 Total assets Liabilities: $ 240 $ 204 Debt Book equity 960 816 $1,200 $1,020 Total liabilities Sources and Uses Sources: $120 Net income Depreciation 80 Borrowing 36 Stock issues 104 $340 Total sources Uses: Increase in net working capital $60 Investment 200 Dividends 80 $340 Total uses 2018 2019 2020 2021 2022 2023 PANEL A Income statement 1 Revenues 2 Costs (92% of revenues) 3 Depreciation (9% of net fixed assets at start of year) 2,200.0 2,640.0 3,168.0 3,801.6 4,561.9 5,474.3 2,024.0 2,428.8 2,914.6 3,497.5 4,197.0 5,036.4 23.5 24.8 29.7 35.6 42.8 51.3 4 EBIT (1 – 2– 3) 152.5 186.5 223.7 268.5 322.2 386.6 5 Interest (10% of long-term debt at start of year) 6 Income before tax (4- 5) 6.0 9.0 15.8 24.0 34.0 46.1 146.5 177.5 207.9 244.4 288.1 340.5 7 Tax at 50% 73.3 88.7 104.0 122.2 144.1 170.2 8 Net income (6 – 7) 9 Dividends (60% of net income) 73.3 88.7 104.0 122.2 144.1 170.2 46.8 53.2 62.4 73.3 86.4 102.1 10 Reinvested earnings (8 – 9) 26.5 35.5 41.6 48.9 57.6 68.1 PANEL B Sources of capital 11 Net income plus depreciation (8+ 3) 96.8 113.5 133.7 157.9 186.8 221.6 Uses of capital 12 Investment in net working capital 50.0 48.4 58.1 69.7 83.6 100.4 13 Investment in fixed assets 30.0 79.8 95.7 114.8 137.8 165.4 14 Dividends (9) 46.8 53.2 62.4 73.3 86.4 102.1 15 Total uses of capital 126.8 181.4 216.2 257.9 307.9 367.9 16 External capital required (15 – 11) 30.1 67.9 82.5 100.0 121.0 146.3 PANEL C Balance sheet (year-end) Assets: 17 Net working capital 242.0 290.4 348.5 418.2 501.8 602.2 18 Net fixed assets 275.0 330.0 396.0 475.2 570.2 684.3 19 Total assets (17 + 18) 517.0 620.4 744.5 893.4 1,072.1 1,286.5 Liabilitles and equlty: 20 Long-term debt (note a) 90.0 157.9 240.4 340.4 461.5 607.8 21 Shareholders' equity (note b) 427.0 462.5 504.1 553.0 610.6 678.7 22 Total liabilities and shareholders' equity (20 +21) 517.0 620.4 744.5 893.4 1,072.1 1,286.5 Financial ratios 23 Debt ratio 0.17 0.25 0.32 0.38 0.43 0.47 24 Interest cover 25.4 20.7 14.2 11.2 9.5 8.4 Columns may not add because of rounding. Note a: Long-term debt, the balancing item increases by exter- nal financing. Note b: Shareholders' oquity equals previous year's value plus reinvested earnings.


