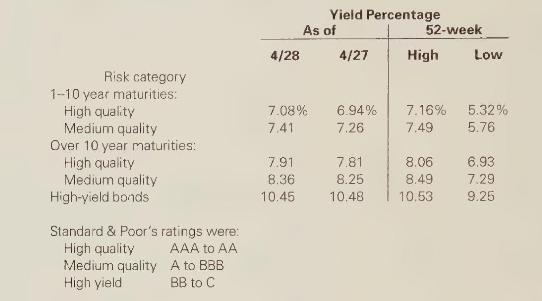
The April 29, 1994, issue of The Wall Street Journal contained a table showing yield compar- 
Question:
The April 29, 1994, issue of The Wall Street Journal contained a table showing yield compar-

isons for groups of corporate bonds. The following data have been adapted from the table:

Required Prepare written answers to the following questions.
a. In each column of numbers, why do the yield rates increase from top to bottom?
b. For the high quality and medium quality bonds, what could account for the increase in the yield rates from \(4 / 27 / 94\) to \(4 / 28 / 94\) ? Take into consideration the economic events occurring at about that time.
c. Which risk class of bonds was closest to its 52 -week high on \(4 / 28 / 94\) ? What could have been the cause?
Step by Step Answer:

Financial Accounting A Business Perspective
ISBN: 9780072289985
7th Edition
Authors: Roger H. Hermanson, James Don Edwards


