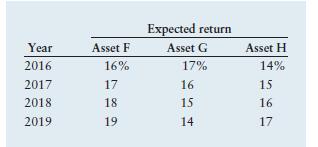
P814 Portfolio analysis You have been given the expected return data shown in the first table on
Question:
P8–14 Portfolio analysis You have been given the expected return data shown in the first table on three assets—F, G, and H—over the period 2016–2019.

Using these assets, you have isolated the three investment alternatives shown in the following table.

a. Calculate the expected return over the 4-year period for each of the three alternatives.
b. Calculate the standard deviation of returns over the 4-year period for each of the three alternatives.
c. Use your findings in parts a and b to calculate the coefficient of variation for each of the three alternatives.
d. On the basis of your findings, which of the three investment alternatives do you recommend? Why?
Fantastic news! We've Found the answer you've been seeking!
Step by Step Answer:
Related Book For 

Principles Of Managerial Finance
ISBN: 9780133546408
7th Edition
Authors: Lawrence J Gitman, Chad J Zutter
Question Posted:


