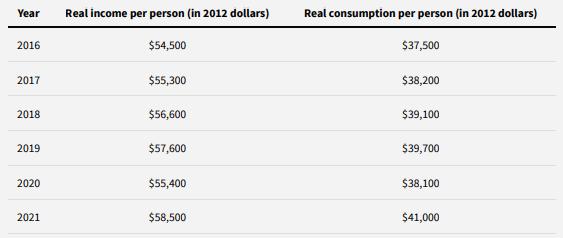
The table below contains data on per-person income and per-person consumption in the United States for several
Question:
The table below contains data on per-person income and per-person consumption in the United States for several years.

a. Draw the consumption function for the United States for these years.
b. What is savings at each level of income?
c. Between 2018 and 2021, how much did income rise? What about consumption? What was the marginal propensity to consume out of the increase?
Step by Step Answer:
Related Book For 

Principles Of Economics
ISBN: 9781319330156,9781319419769
2nd Edition
Authors: Betsey Stevenson, Justin Wolfers
Question Posted:


