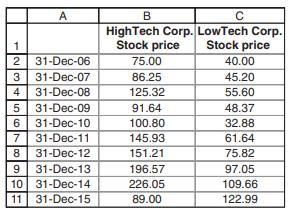
(Descriptive statistics of two stocks) Here is the stock price history of HighTech and LowTech corporations. Calculate:...
Question:
(Descriptive statistics of two stocks) Here is the stock price history of “HighTech” and “LowTech” corporations.

Calculate:
a. The annual returns for each stock.
b. The mean (average) 10-year return for the period for each firm.
Which stock has the higher average return?
c. The variance and the standard deviation of returns, for the period of 10 years for each firm. Which stock is riskier?
d. The covariance and correlation of the returns for each firm. Use two formulas to compute the correlation: The Excel function Correl and the definition
![]()
e. If you had to choose between the two stocks, which would you choose? Explain briefly.
Fantastic news! We've Found the answer you've been seeking!
Step by Step Answer:
Related Book For 

Principles Of Finance Wtih Excel
ISBN: 9780190296384
3rd Edition
Authors: Simon Benninga, Tal Mofkadi
Question Posted:


