Question:
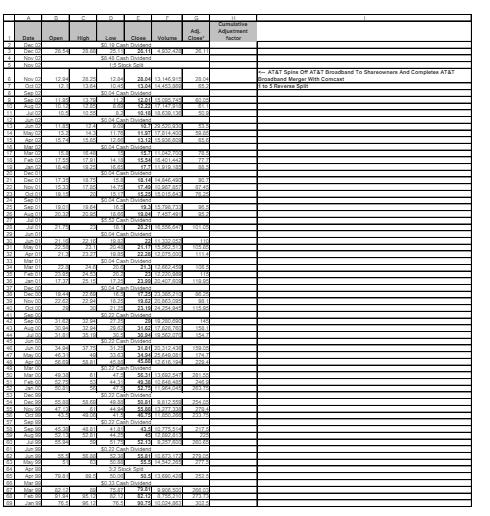
(This is a hard question!) On the disk which comes with the book, you will find 2 years of monthly un-adjusted and adjusted stock price data for AT&T corporation (symbol: T).
Calculate:
16.a. Cumulative adjustment factor for AT&T stock 16.b. What two interesting things happened in November 2002 and what happened to cumulative adjustment factor in this month? Can you explain?
Here’s the data:
Transcribed Image Text:
Date Open High Low Close Volume Ad Close factor $0.19 Cash Dividend +1 5 Nov $0.45 Cath Diddend 15 Stock T O06 12.94 12 2825 1234 10.42 2004 13,146,91 13.044455.000 28.04 3004 Cash Dividend B |$2.2|| 17447,9 13 15 1974 22 14.3 16.11.5737.014408 5004 Cash Dividend 13.545401,44 177919.333 201 20 1739 NoQ1 1533 23 $0.04 Cash buses 17.40 10.907.856 45.20 12.015643 24 251 Sep 0 19.0 24 25 Ain 011 2035 20 27 21 21.72 129 Jam01 $0.04 Cash Duddsod 22.18 May 01 2048 25.17 15 19 AK 32. 33 Apr. 01 Mar 01 203 23.27 1933 22.28 2.075 003 $0.04 Cash Dividend 34 46 20 38 23.90 20.407.000.001 M 2004 Cash Dividens 35 Dec 149 22.83 22.94 16.25 1401 141 $0.22 Cash Dividend 42 148 43 44 45 147 40 May 00 463 500 321 3331243 34.24 25.840.00 747 45.416 $0.27 Cash Dividend Mar00 49.38 61 4T 56.31300254 31 52.75 44.33 47 Dec 50.37 Cath Dividend Dec 2 55.00 SLAR 4838 256 25 55 4494 571 Sep $0.27 Cash Dividend 42 May 185 Apr Mat 44.2 $0.22 Cash Dividend 277 96.12 20.7004.06Y 3275 AT&T Spin Off AT&T Broadband To Shareowners And Complete AT&T Broadband Merger With Comcast to 5 Reverse Split