

(This problem requires some knowledge of portfolio calculations covered in Chapter 8.) Below you will find data...
Question:
(This problem requires some knowledge of portfolio calculations covered in Chapter 8.) Below you will find data on the returns, E r( ) A and E r( ) B , and standard deviations, σA and σB, of stocks A and B. The number ρ is the correlation coefficient of the returns of A and B.
For a portfolio composed of proportion xA of stock A and xB of stock B, the portfolio expected return and standard deviation are given by
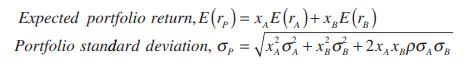
Because the portfolio proportions have to add to 100%, we hvae xB = 1 – xB. A sample calculation of a portfolio expected return and standard deviation is given in cells B15:B16.
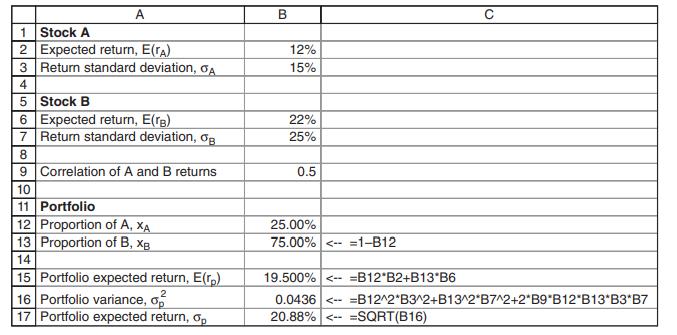
a. Use Solver to compute the proportions xA and xB for a portfolio which has the minimum standard deviation σP.
b. Use Solver and a constraint to compute the proportions xA and xB for a portfolio which has the minimum standard deviation σP and which has a return of at least 18%.
Step by Step Answer:


Principles Of Finance Wtih Excel
ISBN: 9780190296384
3rd Edition
Authors: Simon Benninga, Tal Mofkadi
