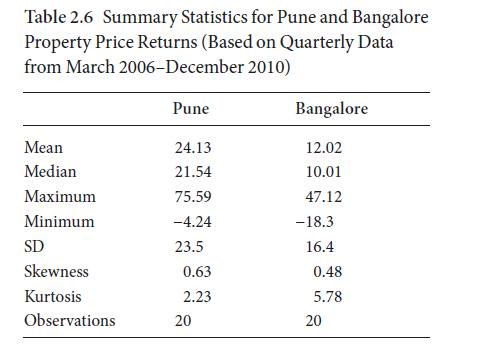
A researcher has taken up a project to compare property price return series between two cities in
Question:
A researcher has taken up a project to compare property price return series between two cities in India, which are presented in Table 2.6. The range of changes is summarized in the form of descriptive statistics:
Now answer the following questions:
a) Which city house price return is more stable? And why? What statistical measures will you use for this?
b) Using the Jarque- Bera test, check whether property returns series follow normal distribution? Find out their p- value range (or level of significance) using chi- square approximation of JB test statistics.
c) In which city property return distribution is more asymmetric?
And why?
d) Where you will obtain these data? Either from primary or secondary sources?
Step by Step Answer:

Basic Statistics For Risk Management In Banks And Financial Institutions
ISBN: 9780192849014
1st Edition
Authors: Arindam Bandyopadhyay


