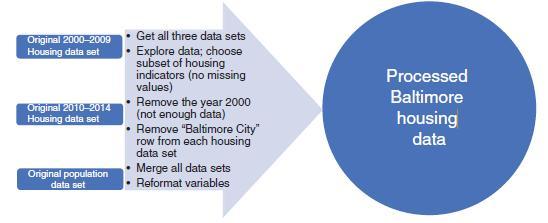
In the textbook companion site, access the motion chart for the Baltimore housing data. Set the x
Question:
In the textbook companion site, access the motion chart for the Baltimore housing data. Set the x axis to “% of Housing Units that are Owner-Occupied” and the y axis to “% of Residential Properties Vacant”.
 a) For 2001, does there appear to be a linear association between “% of Housing Units that are Owner-Occupied” and “% of Residential Properties Vacant”? If so, is it negative or positive?
b) For 2014, does there appear to be a linear association between “% of Housing Units that are Owner-Occupied” and “% of Residential Properties Vacant”? If so, is it negative or positive?
c) How is the 2014 association compared to the 2011 one?
Fantastic news! We've Found the answer you've been seeking!
Step by Step Answer:
Related Book For 

Principles Of Managerial Statistics And Data Science
ISBN: 9781119486411
1st Edition
Authors: Roberto Rivera
Question Posted:


