

20. Consider the data about project activities given in the table subsequently. a. Create the Gantt chart.
Question:
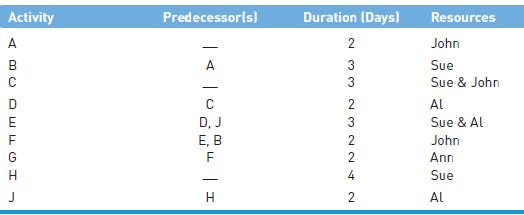
20. Consider the data about project activities given in the table subsequently.
a. Create the Gantt chart. Schedule the work in such a way that each person always has only one task to perform (do not reduce the durations of activities or insert buffers as yet).
b. Indicate the critical chain.
c. Indicate where the feeding buffers should be inserted.
d. What is the difference in the lengths of the critical path and the critical chain?
Fantastic news! We've Found the answer you've been seeking!
Step by Step Answer:

Answered By
Joemar Canciller
I teach mathematics to students because I love to share what I have in this field.
I also want to see the students to love math and be fearless in this field.
I've been tutoring these past 2 years and I would like to continue what I've been doing.
1+ Reviews
10+ Question Solved
Related Book For 

Project Management For Engineering Business And Technology
ISBN: 9780367277345,9781000092561
6th Edition
Authors: John M. Nicholas , Herman Steyn
Question Posted:
