The 1-day 99% VaR is calculated using historical simulation for the four-index example in Section 22.2 as
Question:
The 1-day 99% VaR is calculated using historical simulation for the four-index example in Section 22.2 as $422,291. Look at the underlying spreadsheets on the author’s website and calculate using historical simulation:
(a) the 1-day 95% VaR,
(b) the 1-day 95% ES,
(c) the 1-day 97% VaR, and
(d) the 1-day 97% ES.
Repeat your calculations using the model-building approach.
Data From Section 22.2:
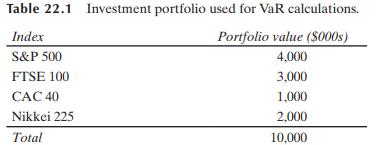
To illustrate the calculations underlying the approach, suppose that an investor in the United States owns, on July 8, 2020, a portfolio worth $10 million consisting of investments in four stock indices: the S&P 500 in the United States, the FTSE 100 in the United Kingdom, the CAC 40 in France, and the Nikkei 225 in Japan. The value of the investment in each index on July 8, 2020, is shown in Table 22.1. An Excel spreadsheet containing 501 days of historical data on the closing prices of the four indices, together with exchange rates and a complete set of VaR and ES calculations are on the author’s website:

Step by Step Answer:


