The following table shows the composition of US federal expenditures in 1993, 1997, 2001, and 2005. From
Question:
The following table shows the composition of US federal expenditures in 1993, 1997, 2001, and 2005.
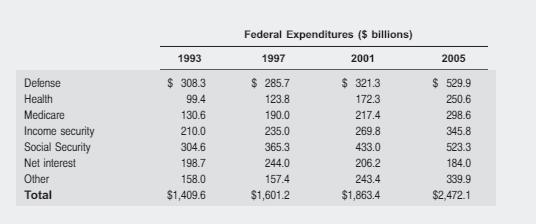
From 1993 to 1997, GDP went from $6.6574 trillion to $8.3043 trillion, the GDP price deflator (used to calculate inflation) went from 88.381 to 95.414, and the population went from 260.255 million to 272.912 million.
From 2001 to 2005, GDP went from $10.128 trillion to $13.1947 trillion, the GDP price deflator went from 102.399 to 113.000, and the population went from 285.454 million to 296.940 million.
a. For the years 1993 to 1997 and 2001 to 2005, calculate the absolute change in federal expenditures, the change in federal expenditures in real (i.e., inflation-adjusted) terms, the change in real government expenditures per capita, and the change in expenditures per GDP.
b. Which components of the budget had the largest relative increases from 1993 to 1997 and from 2001 to 2005? Which had the largest relative decreases?
Step by Step Answer: