

8. Determine the central lines and control limits for Z and W charts with a subgroup size...
Question:
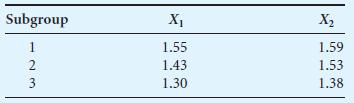
8. Determine the central lines and control limits for Z and W charts with a subgroup size of 2 and draw the graphs. If the target X is 1.50 and the target R is 0.08, determine the plotted points for three subgroups.
Step by Step Answer:

This question has not been answered yet.
You can Ask your question!
Related Book For 
Question Posted:
