

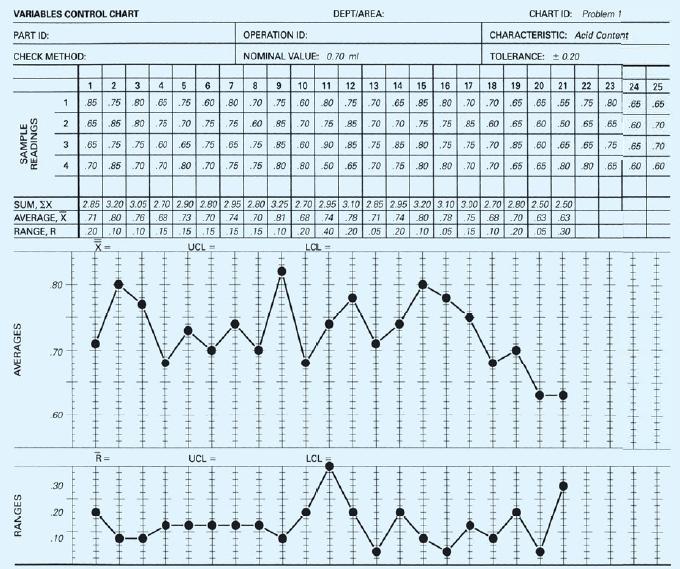
Given is a typical X and R chart form with information on acid content in milliliters. Complete
Question:
Given is a typical X and R chart form with information on acid content in milliliters. Complete the calculations for subgroups 22, 23, 24, and 25. Plot the points to complete the run chart. Construct a control chart by calculating and drawing the trial central line and limits. Analyze the plotted points to determine if the process is stable.
Step by Step Answer:

This question has not been answered yet.
You can Ask your question!
Related Book For 
Question Posted:
