

Question: Please comment on the diagram below: 18 16 14 12 10 8 E 42 Exercise 7 Histogram 230 235 240 245 250 255 260 265
Please comment on the diagram below:
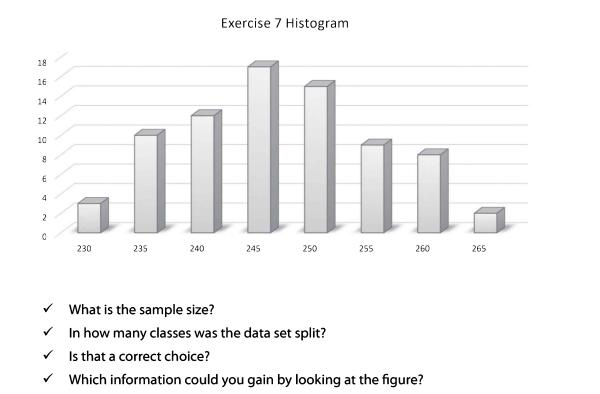
18 16 14 12 10 8 E 42 Exercise 7 Histogram 230 235 240 245 250 255 260 265 What is the sample size? In how many classes was the data set split? Is that a correct choice? Which information could you gain by looking at the figure?
Step by Step Solution
There are 3 Steps involved in it
1 Expert Approved Answer
Step: 1 Unlock

Question Has Been Solved by an Expert!
Get step-by-step solutions from verified subject matter experts
Step: 2 Unlock
Step: 3 Unlock