

Question: Stern-Volmer plot. The table shows intensity and lifetime data for luminescence of the ruthenium complex in Figure 19-21 for a range of oxygen concentrations. a.
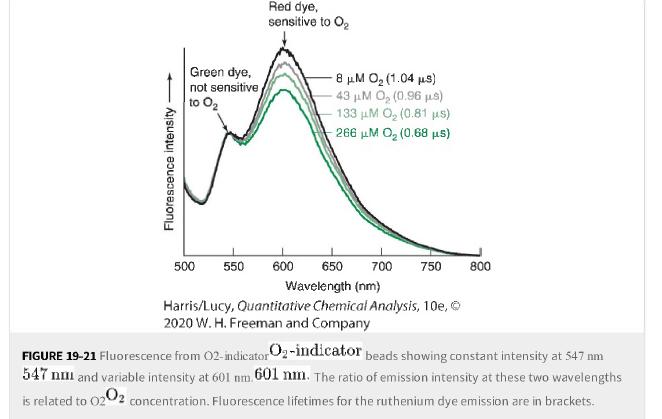
Stern-Volmer plot. The table shows intensity and lifetime data for luminescence of the ruthenium complex in Figure 19-21 for a range of oxygen concentrations.
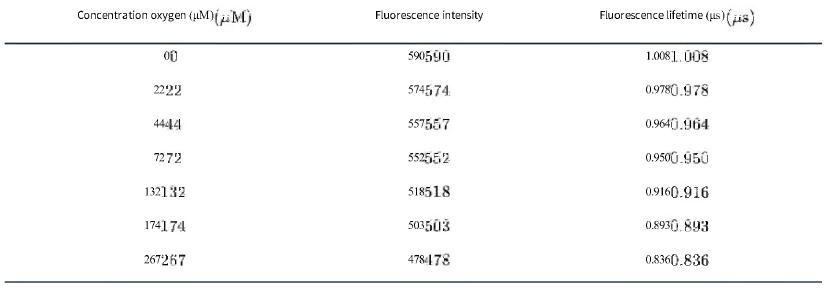
a. Why does the luminescence intensity decrease as the oxygen concentration increases?
b. Plot a Stern-Volmer graph based on fluorescence intensity. Is the calibration linear?
c. Plot a Stern-Volmer graph based on fluorescence lifetime. What type of quenching is indicated by the plot?
Figure 19-21
Concentration oxygen (UM)(M) 00 2222 4444 7272 132132 174174 267267 Fluorescence intensity 590590 574574 557557 552552 518518 503503 478478 Fluorescence lifetime (us) (s) 1.0081.008 0.9780.978 0.9640.964 0.9500.950 0.9160.916 0.8930.893 0.8360.836
Step by Step Solution
3.40 Rating (156 Votes )
There are 3 Steps involved in it
Answer a As oxygen concentration increases the luminescence intensity decreases because ... View full answer

Get step-by-step solutions from verified subject matter experts