A local E-Z Mart sells popular grocery items to their customers. One of the most popular items that are purchased is low-fat milk. Currently, the
A local E-Z Mart sells popular grocery items to their customers. One of the most popular items that are purchased is low-fat milk. Currently, the store sells a gallon of low-fat milk to their customers for $3.00/gallon. Currently, the manager orders 62 jugs of low-fat milk per week from the local distributor at a cost of $2.00/gallon.
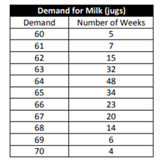
The demand of 1-gallon jugs of low-fat milk has varied between 60 and 70 jugs per week at a local E ? Z. Mart convenience store. The frequency distribution of this demand is shown below in the table
 Recently, a few customers have complained to the manager because on a number of occasions they have not been able to purchase low-fat milk because the store was out of stock.
If the store runs out of low-fat milk, the store applies a stock out cost of $0.50/gallon. In addition, any milk that is unsold at the end of the week is scrapped. Unsold milk at the end of the week is a total loss for the store and the manager is afraid to order too much milk per week. However, the manager aims to please his customers and wants to use simulation to determine whether he should increase his weekly order from his distributor.
1. Use the frequency table of weekly demand of gallons of low-fat milk to compute the percentage and the lower and upper bounds for the probability distribution.
Apply Data Bar conditional formatting (i.e. Solid Fill Blue) for Frequency of gallons of low-fat milk being sold per week.
2. Create a simulation model for 10 weeks of operation. Generate random values of demand based on the probability distribution. For the remaining calculations that are needed, you are free to use formulas such as IF, MIN, and MAX.
3. After you have completed the first run of the simulation, summarize the first replicate by computing the desired descriptive statistics.
4. Based on the first run of the simulation, create a Data Table to generate 200 replicates for the simulation.
Demand for Milk (jugs) Demand 60 61 62 63 64 65 66 67 68 69 70 Number of Weeks 5 7 15 32 48 34 23 20 14 6 4
Step by Step Solution
3.47 Rating (157 Votes )
There are 3 Steps involved in it
Step: 1
Initial Conditions Fixed Order Quantity 60 Initial Conditions Selling PriceGallon 300 CostGallon 200 ...
See step-by-step solutions with expert insights and AI powered tools for academic success
Step: 2

Step: 3

Document Format ( 2 attachments)
608f04cfc62b4_20777.pdf
180 KBs PDF File
608f04cfc62b4_20777.docx
120 KBs Word File
Ace Your Homework with AI
Get the answers you need in no time with our AI-driven, step-by-step assistance
Get Started


