Question
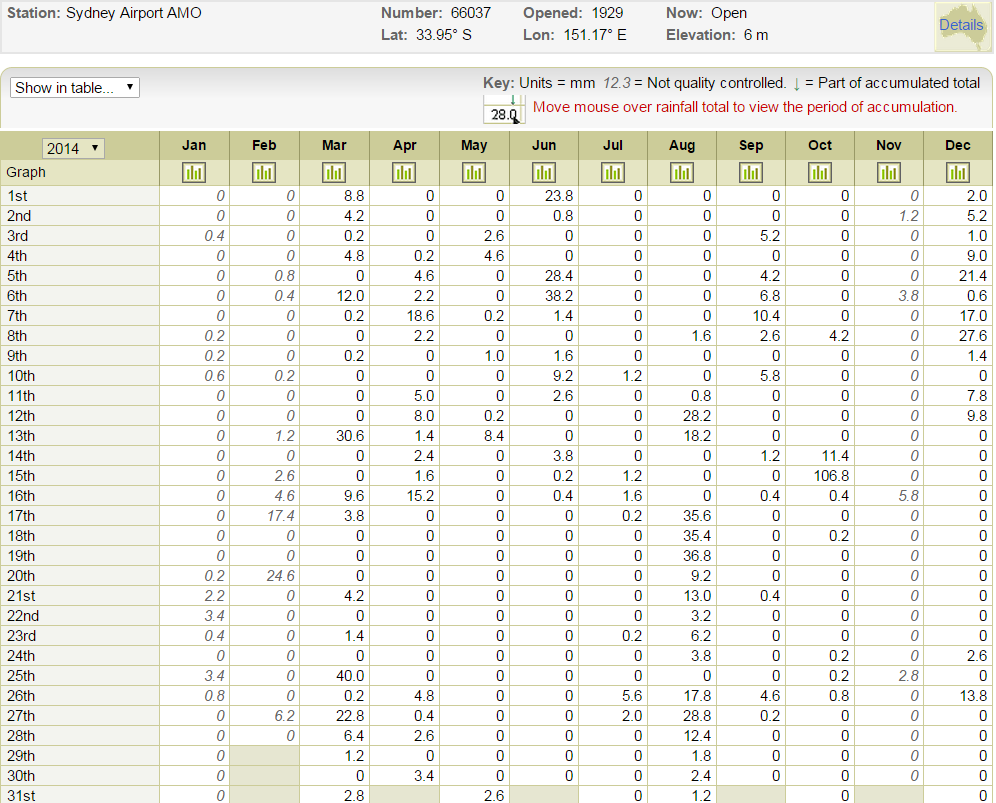
(a) The following data collected from the Australian Bureau of Meteorology Website (http://www.bom.gov.au/climate/data/?ref=ftr) gives the daily rainfall data for the year 2014 in Sydney (recorded
(a) The following data collected from the Australian Bureau of Meteorology Website (http://www.bom.gov.au/climate/data/?ref=ftr) gives the daily rainfall data for the year 2014 in Sydney (recorded in mm at Sydney Airport). The zero values indicate no rainfall and the left-most column gives the date. Assuming that Rainfall or No-Rainfall event follows a Poisson distribution:
(i) What is the probability that on any given week in a year there would be no rainfall?
(ii) What is the probability that there will be 2 or more days of rainfall in a week? (There are 52 weeks in a year and a week is assumed to start from Monday).

(b) Assuming that the weekly total amount of rainfall from the data provided in part (a) has a normal distribution, compute the mean and standard deviation of weekly totals.
(i) What is the probability that in a given week there will be between 4 mm and 12 mm of rainfall?
(ii) What is the amount of rainfall if only 8% of the weeks have that amount of rainfall or higher?
Station: Sydney Airport AMO Show in table... Graph 1st 2nd 3rd 4th 5th 6th 7th 8th 9th 10th 11th 12th 13th 14th 15th 16th 17th 18th 19th 20th 21st 22nd 23rd 24th 25th 26th 27th 28th 29th 30th 31st 2014 Jan E 0 0 0.4 0 0 0 0 0.2 0.2 0.6 0 0 0 0 0 0 0 0 0 0.2 2.2 3.4 0.4 0 3.4 0.8 0 0 0 0 0 Feb 0 0 0 0 0.8 0.4 0 0 0 0.2 0 0 1.2 0 2.6 4.6 17.4 0 0 24.6 0 0 0 0 0 0 6.2 0 Mar XX 8.8 4.2 0.2 4.8 0 12.0 0.2 0 0.2 0 0 0 30.6 0 0 9.6 3.8 0 0 0 4.2 0 1.4 0 40.0 0.2 22.8 6.4 1.2 0 2.8 Number: 66037 Lat: 33.95 S Apr 0 0 0 0.2 4.6 2.2 18.6 2.2 0 0 88 5.0 8.0 1.4 2.4 1.6 15.2 0 0 0 0 0 0 0 0 0 4.8 0.4 2.6 0 3.4 May 0 Key: Units = mm 12.3= Not quality controlled. = Part of accumulated total 28.0 Move mouse over rainfall total to view the period of accumulation. Aug Sep 0 2.6 4.6 0 0 0.2 0 1.0 0 0 0.2 8.4 0 0 0 0 0 0 0 0 0 0 0 0 0 0 0 0 Opened: 1929 Lon: 151.17 E 0 2.6 Jun I 23.8 0.8 0 0 28.4 38.2 1.4 0 1.6 9.2 2.6 0 0 3.8 0.2 0.4 0 0 0 0 0 0 0 0 0 0 0 0 0 0 Jul E 0 0 0 0 0 0 0 0 0 1.2 0 0 0 0 1.2 1.6 0.2 0 0 0 0 0 0.2 Now: Open Elevation: 6 m 0 0 5.6 2.0 0 0 0 0 0 0 0 0 0 0 0 1.6 0 0 0.8 28.2 18.2 0 0 0 35.6 35.4 36.8 9.2 13.0 3.2 6.2 3.8 0 17.8 28.8 12.4 1.8 2.4 1.2 0 0 5.2 0 4.2 6.8 10.4 2.6 0 5.8 0 0 0 1.2 0 0.4 0 0 0 0 0.4 0 0 0 0 4.6 0.2 0 0 0 Oct M 0 0 0 0 0 0 0 4.2 0 0 0 0 0 11.4 106.8 0.4 0 0.2 0 0 0 0 0 0.2 0.2 0.8 0 0 0 0 0 Nov da 0 1.2 0 0 0 3.8 0 0 0 0 0 0 0 0 0 5.8 0 0 0 0 0 0 0 0 2.8 0 Details 0 0 0 0 Dec h 2.0 5.2 1.0 9.0 21.4 0.6 17.0 27.6 1.4 0 7.8 9.8 0 0 0 0 0 0 0 0 0 0 0 2.6 0 13.8 0 0 0 0 0
Step by Step Solution
3.37 Rating (156 Votes )
There are 3 Steps involved in it
Step: 1
a The following data collected from the Australian Bureau of Meteorology Website httpwwwbomgovauclim...
Get Instant Access to Expert-Tailored Solutions
See step-by-step solutions with expert insights and AI powered tools for academic success
Step: 2

Step: 3

Ace Your Homework with AI
Get the answers you need in no time with our AI-driven, step-by-step assistance
Get Started


