Question
Consider the market for umbrellas. Suppose the quantity of umbrellas demanded by consumers (Q D ) depends on the price of an umbrella (P) and
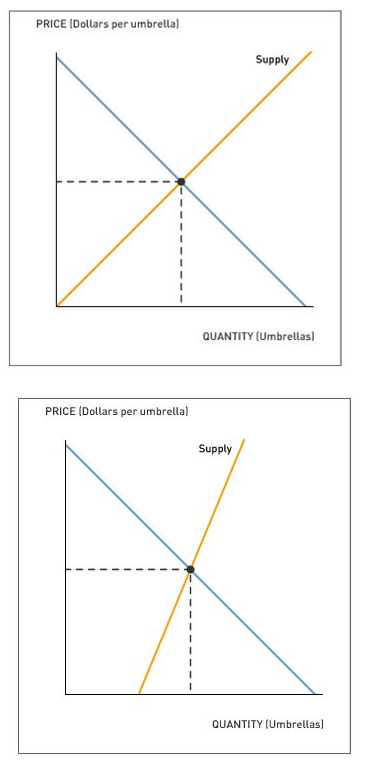
Consider the market for umbrellas. Suppose the quantity of umbrellas demanded by consumers (Q D ) depends on the price of an umbrella (P) and the percentage chance of rain (R) forecasted by the local news station. Similarly, the quantity of umbrellas supplied by producers (Q S ) depends on the price of an umbrella (P) and the square-foot price of waterproof nylon (N) used in the production of umbrellas.
The following two graphs depict the market for umbrellas in two separate regions. Suppose the chance of rain Increases to 90% in both regions. On each of the graphs, show the effect this has on the market for umbrellas by shifting the demand curve, the supply curve, or both.
 In both markets, this change in the weather forecast causes the equilibrium quantity to ____________ equilibrium price to _________________________
You can see that although the affected curve shifted by the same amount in both markets, the effect on the equilibrium price is greater in the market with more ___________ supply.
PRICE (Dollars per umbrella) PRICE (Dollars per umbrella) Supply QUANTITY (Umbrellas) Supply QUANTITY (Umbrellas)
Step by Step Solution
3.29 Rating (152 Votes )
There are 3 Steps involved in it
Step: 1
Demand curve would shift to the right in both the regio...
Get Instant Access to Expert-Tailored Solutions
See step-by-step solutions with expert insights and AI powered tools for academic success
Step: 2

Step: 3

Document Format ( 2 attachments)
6094284f060f2_24545.pdf
180 KBs PDF File
6094284f060f2_24545.docx
120 KBs Word File
Ace Your Homework with AI
Get the answers you need in no time with our AI-driven, step-by-step assistance
Get Started


