Question
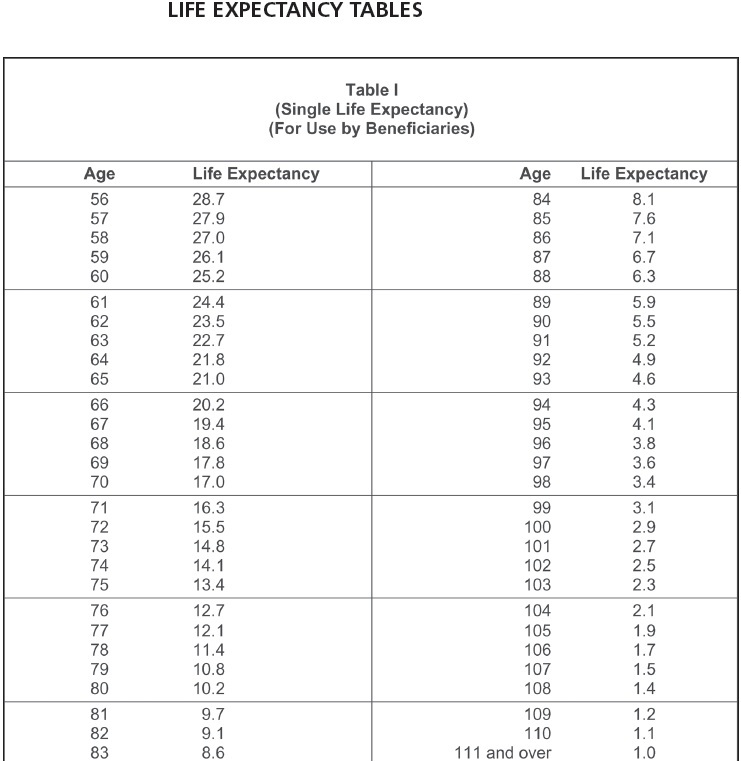
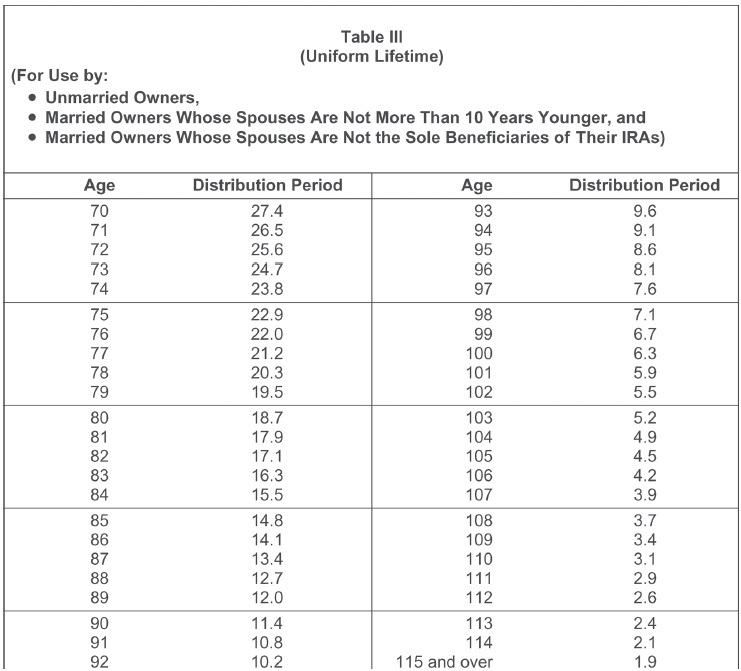
Determine the tax-free amount of the monthly payment in each of the following instances. Use the life expectancy tables. Use Table I, Table III and
Determine the tax-free amount of the monthly payment in each of the following instances. Use the life expectancy tables. Use Table I, Table III and Table V. SHOW ALL WORK!!
a. Person A is age 62 and purchased an annuity for $98,000. The annuity pays $2,200 per month for life.(Round exclusion percentage computation to one decimal place.)
b. Person B is 66 and purchased an annuity for $96,000. The annuity pays $1,750 per month for life. (Round exclusion percentage computation to one decimal place. Round your final answer to 2 decimal places.)
c. Person C is 55 and purchased an annuity for $56,000 that pays a monthly payment of $1,350 for 15 years.(Round exclusion percentage computation to one decimal place. Round your final answer to 2 decimal places.)
Table V-
| AGE | MULTIPLE | AGE | MULTIPLE | AGE | MULTIPLE |
| 5 | 76.6 | 42 | 40.6 | 79 | 10 |
| 6 | 75.6 | 43 | 39.6 | 80 | 9.5 |
| 7 | 74.7 | 44 | 38.7 | 81 | 8.9 |
| 8 | 73.7 | 45 | 37.7 | 82 | 8.4 |
| 9 | 72.7 | 46 | 36.8 | 83 | 7.9 |
| 10 | 71.7 | 47 | 35.9 | 84 | 7.4 |
| 11 | 70.7 | 48 | 34.9 | 85 | 6.9 |
| 12 | 69.7 | 49 | 34 | 86 | 6.5 |
| 13 | 68.8 | 50 | 33.1 | 87 | 6.1 |
| 14 | 67.8 | 51 | 32.2 | 88 | 5.7 |
| 15 | 66.8 | 52 | 31.3 | 89 | 5.3 |
| 16 | 65.8 | 53 | 30.4 | 90 | 5 |
| 17 | 64.8 | 54 | 29.5 | 91 | 4.7 |
| 18 | 63.9 | 55 | 28.6 | 92 | 4.4 |
| 19 | 62.9 | 56 | 27.7 | 93 | 4.1 |
| 20 | 61.9 | 57 | 26.8 | 94 | 3.9 |
| 21 | 60.9 | 58 | 25.9 | 95 | 3.7 |
| 22 | 59.9 | 59 | 25 | 96 | 3.4 |
| 23 | 59 | 60 | 24.2 | 97 | 3.2 |
| 24 | 58 | 61 | 23.3 | 98 | 3 |
| 25 | 57 | 62 | 22.5 | 99 | 2.8 |
| 26 | 56 | 63 | 21.6 | 100 | 2.7 |
| 27 | 55.1 | 64 | 20.8 | 101 | 2.5 |
| 28 | 54.1 | 65 | 20 | 102 | 2.3 |
| 29 | 53.1 | 66 | 19.2 | 103 | 2.1 |
| 30 | 52.2 | 67 | 18.4 | 104 | 1.9 |
| 31 | 51.2 | 68 | 17.6 | 105 | 1.8 |
| 32 | 50.2 | 69 | 16.8 | 106 | 1.6 |
| 33 | 49.3 | 70 | 16 | 107 | 1.4 |
| 34 | 48.3 | 71 | 15.3 | 108 | 1.3 |
| 35 | 47.3 | 72 | 14.6 | 109 | 1.1 |
| 36 | 46.4 | 73 | 13.9 | 110 | 1 |
| 37 | 45.4 | 74 | 13.2 | 111 | 0.9 |
| 38 | 44.4 | 75 | 12.5 | 112 | 0.8 |
| 39 | 43.5 | 76 | 11.9 | 113 | 0.7 |
| 40 | 42.5 | 77 | 11.2 | 114 | 0.6 |
| 41 | 41.5 | 78 | 10.6 | 115 | 0.5 |


Age 56 57 58 59 60 61 62 63 64 65 66 67 68 69 70 71 72 73 74 75 76 77 78 79 80 81 82 83 LIFE EXPECTANCY TABLES Life Expectancy 28.7 27.9 27.0 26.1 25.2 24.4 23.5 22.7 21.8 21.0 20.2 19.4 18.6 17.8 17.0 16.3 15.5 14.8 14.1 13.4 12.7 12.1 11.4 10.8 10.2 Table I (Single Life Expectancy) (For Use by Beneficiaries) 9.7 9.1 8.6 Age 84 85 86 87 88 89 90 91 92 93 94 95 96 97 98 99 100 101 102 103 104 105 106 107 108 109 110 111 and over Life Expectancy 8.1 7.6 7.1 6.7 6.3 5.9 5.5 5.2 4.9 4.6 4.3 4.1 3.8 3.6 3.4 3.1 2.9 2.7 2.5 2.3 2.1 1.9 1.7 1.5 1.4 1.2 1.1 1.0 (For Use by: Unmarried Owners, Married Owners Whose Spouses Are Not More Than 10 Years Younger, and Married Owners Whose Spouses Are Not the Sole Beneficiaries of Their IRAS) Age 70 71 72 73 74 75 76 77 78 79 80 81 82 83 84 85 86 87 88 89 90 91 92 Distribution Period 27.4 26.5 25.6 24.7 23.8 22.9 22.0 21.2 20.3 19.5 18.7 17.9 17.1 16.3 15.5 Table III (Uniform Lifetime) 14.8 14.1 13.4 12.7 12.0 11.4 10.8 10.2 Age 93 94 95 96 97 98 99 100 101 102 103 104 105 106 107 108 109 110 111 112 113 114 115 and over Distribution Period 9.6 9.1 8.6 8.1 7.6 7.1 6.7 6.3 5.9 5.5 5.2 4.9 4.5 4.2 3.9 3.7 3.4 3.1 2.9 2.6 2.4 2.1 1.9
Step by Step Solution
There are 3 Steps involved in it
Step: 1
Computation of taxfree amount of the monthly payment in ...
Get Instant Access to Expert-Tailored Solutions
See step-by-step solutions with expert insights and AI powered tools for academic success
Step: 2

Step: 3

Ace Your Homework with AI
Get the answers you need in no time with our AI-driven, step-by-step assistance
Get Started


